



Budget Allocation for AI Visibility: Team, Tools, and Platform Spend
A tactical guide to AI visibility resource allocation: team structure, tool spend vs. content spend, platform-specific budgets for ChatGPT, Perplexity, and Gemi...
10 min read
Build an AI search visibility budget with cost tiers, ROI calculations and executive talking points.
Here’s a sobering fact: 30% of B2B marketing budgets are completely invisible to AI search engines. That’s the finding from Gartner’s 2025 CMO Spend Survey, which shows that paid media (the largest single line item in most marketing budgets) cannot be cited by ChatGPT, Perplexity, Gemini, or any other generative AI system. As buyers increasingly turn to AI search to research solutions, those dollars are structurally excluded from the primary discovery channel that matters most.
The problem runs deeper than lost visibility. Gartner predicted in early 2024 that traditional search engine volume would drop 25% by 2026 as buyers shift to AI chatbots and virtual agents. That prediction is tracking. LinkedIn observed a 60% decline in non-brand organic traffic across a subset of B2B topics, even while rankings remained stable. Ahrefs measured a 58% click reduction for top-ranking pages when Google surfaces AI Overviews, a figure that climbed from 34.5% in just eight months.
The discovery layer is shifting. Budget allocation has not.
This guide gives you everything you need to build a defensible AI search visibility budget line item for 2026: exact cost breakdowns by tier, a working ROI calculation framework with real numbers, a decision matrix for in-house vs. agency vs. tools-only approaches, and the talking points and presentation templates to justify the investment to your CFO. By the end, you’ll have a concrete plan to allocate between $10K and $300K+ annually to AI visibility, track measurable returns, and position your brand to be cited when AI engines answer your customers’ most important questions.
The shift from “search and click” to “ask and answer” is not theoretical. Pew Research Center measured a 46.7% relative decline in clicks for queries that surface an AI Overview, tracking 68,000 queries under controlled conditions. Semrush found that 83% of AI Overview searches and 93% of AI Mode searches end without a click to any website.
Informational content absorbs most of the impact. AI Overviews answer the queries that used to send users to blog posts, guides, and comparison pages. A page that ranked #1 for an informational query now competes with an AI-generated answer positioned above it. That answer is composed from multiple sources, but your brand may not be one of them.
The mechanism matters: AI engines don’t rank pages the way Google does. They synthesize information from multiple sources and cite only 2–7 domains per response. Google shows 10 blue links; ChatGPT shows one or two citations. Your traditional SEO strategy was built for the first model. AI visibility requires optimizing for the second.
Forrester’s 2026 Budget Planning Guide is direct about the problem: 30.6% of B2B marketing budgets go to paid media, including display ads, sponsored posts, promoted content, and paid search. AI engines cannot cite any of it. When ChatGPT, Perplexity, or Gemini compose an answer about your category, they pull from third-party editorial coverage in publications they weight as credible. Sponsored content does not exist in that layer.
The largest single line item in most B2B budgets is structurally excluded from the fastest-growing research channel buyers use. That gap is the competitive window of 2026.
This is where the business case becomes undeniable. Semrush data shows that visitors referred from AI search convert at 4.4 times the rate of traditional organic traffic. That’s not because AI-referred visitors are more qualified, though they often are. It’s because they’ve already been pre-screened by the AI. If an LLM recommends your solution, the buyer has already passed a credibility threshold.
Additionally, cited brands see a 35% lift in organic CTR over brands that AI engines do not cite. Being mentioned in the AI’s response drives downstream clicks to your website, even though the AI answer itself answers the query.
The math is clear: AI visibility is not a brand-building exercise. It’s a direct driver of conversions and revenue.
Before you can justify budget to your CFO, you need to know what you’re actually paying for. AI visibility budgets break into three distinct tiers, each with different cost drivers, outcomes, and ideal use cases.
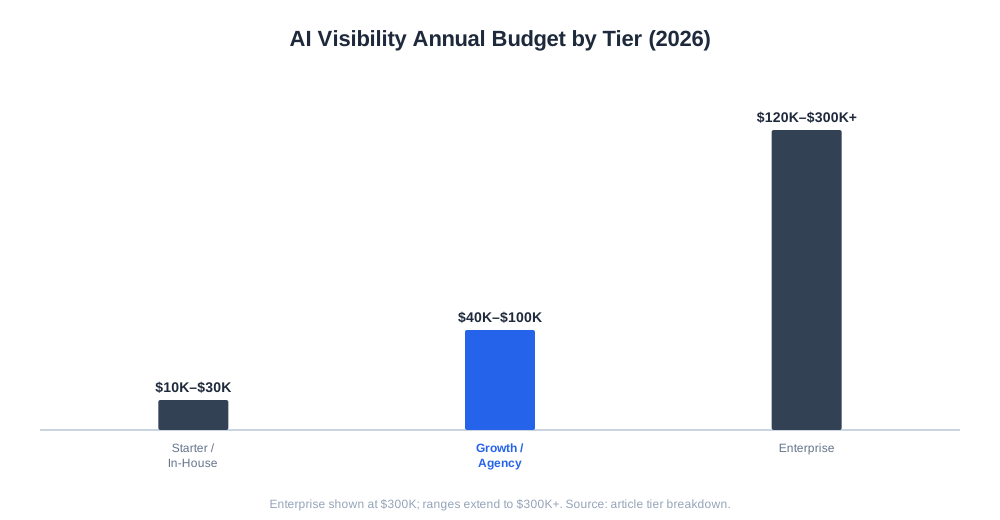
What’s included: Basic AI monitoring across 1–2 engines (usually ChatGPT and Google AI Overviews), quarterly schema and FAQ updates, foundational structured data implementation, and monthly reporting.
Best for: Mid-market companies with existing SEO expertise and solid foundational content. You’re not building from zero; you’re extending what you already have.
Cost breakdown within tier:
Realistic outcome: You’ll establish baseline AI visibility, optimize your FAQ and schema, and start tracking citations. You won’t be winning competitive high-intent queries, but you’ll stop bleeding visibility to AI-generated answers. This tier is defensive; it protects what you have.
What’s included: Full-service agency management, monitoring across 4–5 AI platforms (ChatGPT, Google AI Overviews, Perplexity, Gemini, Claude), active content optimization, earned media placements, and quarterly strategy reviews. This is where most mid-market brands should start.
Best for: Companies competing in high-intent categories where AI citations directly influence buying decisions. You have solid SEO fundamentals but lack the expertise or bandwidth to run AI visibility in-house.
Cost breakdown within tier:
Realistic outcome: You’ll be actively cited in AI responses, competing for high-intent queries, and seeing measurable lift in organic CTR and conversions. Your brand becomes part of the “consensus” that AI engines reference when answering category-level questions.
What’s included: Enterprise-grade platform, global AI monitoring across 6+ engines, continuous prompt testing, large-scale schema deployment, dedicated PR and authority-building programs, SOC 2-compliant tracking, and monthly strategy sessions.
Best for: Large organizations with complex, multi-product catalogs, global markets, or highly competitive verticals where every citation is worth significant revenue. Brands that can justify the investment because the upside is measured in millions.
Cost breakdown within tier:
Realistic outcome: Your brand becomes a “trusted source” that AI engines cite across multiple categories. You’re not just getting citations; you’re shaping the narrative that AI engines use to answer questions in your space.
| Tier | Annual Budget | Monthly Retainer | Tools | Content | Earned Media | Technical | Best For |
|---|---|---|---|---|---|---|---|
| Starter | $10K–$30K | $833–$2,500 | $200–$500/mo | Internal + light refresh | Minimal | Basic schema | In-house teams, defensive posture |
| Growth | $40K–$100K | $3,333–$8,333 | $1,500–$3,000/mo | Active optimization | $8K–$20K/yr | Moderate | Mid-market, competitive categories |
| Enterprise | $120K–$300K+ | $10K–$25K+ | $2K–$5K/mo | High volume, continuous | $20K–$50K/yr | Advanced | Large orgs, multi-product, global |
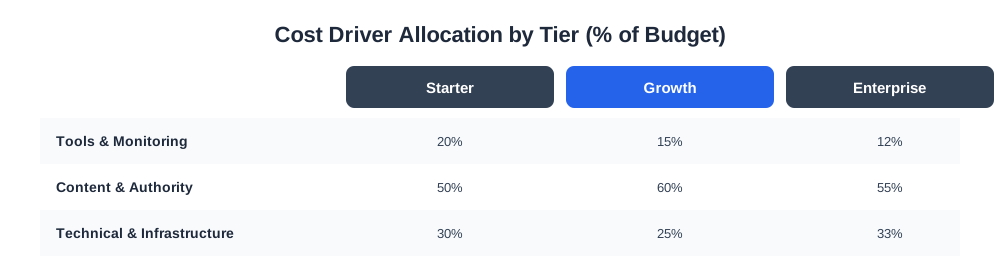
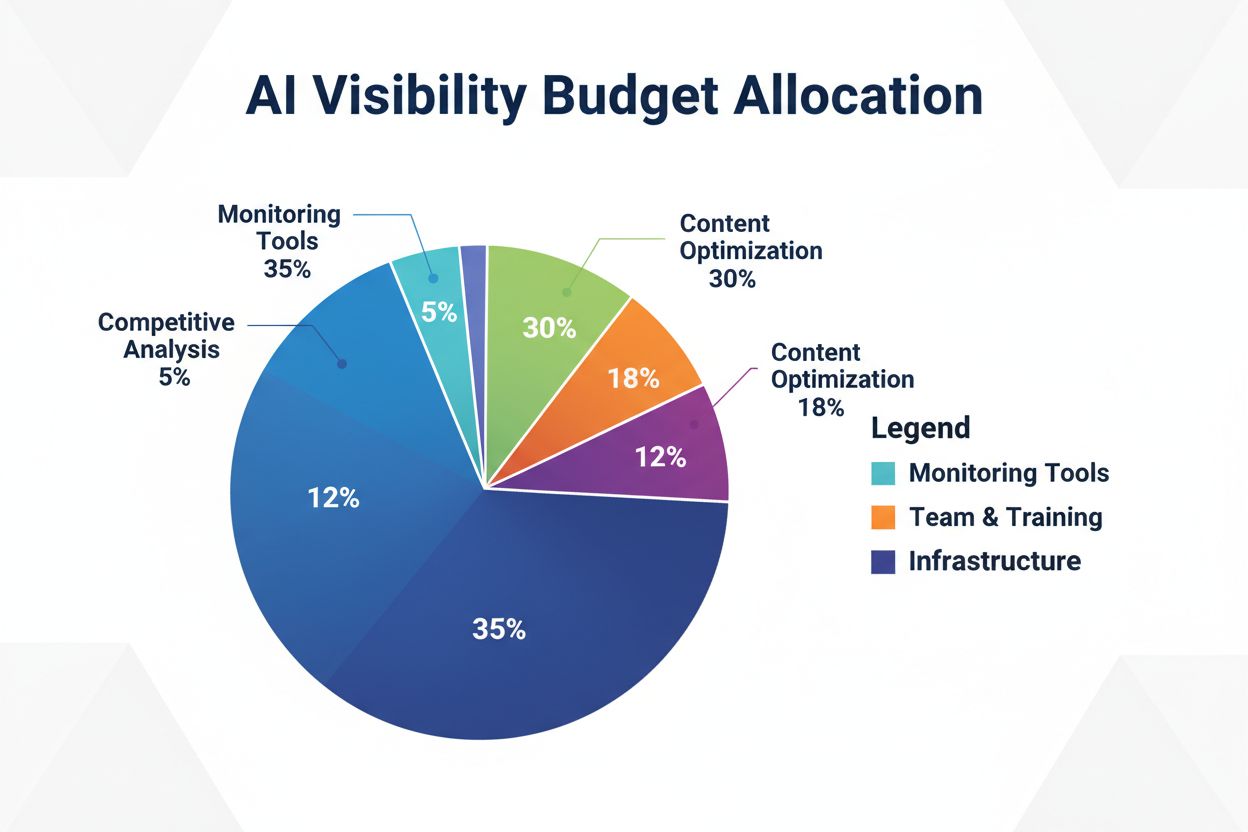
Understanding where the money goes is essential for both budgeting and justification. AI visibility budgets break into three primary cost buckets, and the allocation shifts depending on your tier and strategy.
Traditional rank trackers like Semrush and Ahrefs don’t fully capture LLM behaviors. You need tools designed to run automated prompts across multiple AI engines and monitor “Share of Voice” and citation patterns. AmICited is one of the strongest options for exactly this job: it tracks citation rate and share of voice across ChatGPT, Perplexity, and Google AI Overview in a single view, which is the core dataset your budget case and CFO presentation both depend on.
Entry-level platforms ($200–$500/month) track ChatGPT and Google AI Overviews, run basic prompt testing, and provide monthly reports. They’re sufficient for testing but limited in automation and multi-engine coverage.
Mid-market platforms ($1,000–$2,500/month) add multi-engine monitoring (Perplexity, Gemini, Claude), automated prompt testing, sentiment analysis, and competitive benchmarking. This is where most Tier 2 companies operate.
Enterprise platforms ($2,000–$5,000+/month) include Conductor, BrightEdge Enterprise, or specialized GEO tools. They offer global market monitoring, continuous testing across 6+ engines, custom integrations, and advanced analytics. The cost scales with the number of LLMs tracked, the frequency of prompt testing, and the number of regional markets you monitor.
Cost levers: If you’re tracking only ChatGPT and Google AI Overviews, you’re at the lower end. If you’re monitoring Perplexity, Gemini, Claude, Bing Copilot, and proprietary industry-specific engines, you’re at the upper end. Each additional engine typically adds $200–$500/month.
This is where most of your budget goes, and it’s also where most companies underestimate costs. AI visibility is not achieved through schema markup alone. It’s achieved through being cited as a credible source across the web.
Category Entry Point (CEP) Optimization: Writing long-form, highly structured, evidence-backed guides addressing specific high-intent questions. Examples: “What is the most secure CRM for healthcare teams?” or “How to choose a workflow automation platform for enterprise.” These pieces are designed to be discovered, summarized, and cited by AI engines. They typically cost $2,000–$5,000 per piece (research, writing, optimization) and require 20–50 pieces annually depending on your category breadth.
Off-site “Influence Graph” Seeding: Managing citations on trusted third-party platforms that AI models scrape heavily: Reddit, Quora, industry forums, Wikipedia/Wikidata, Medium, LinkedIn, and major media publications. This is not paid advertising; it’s earned media. It requires strategy, relationship management, and content seeding. Budget $8,000–$20,000/year for active programs, more for enterprise-scale operations.
Third-party Editorial Placements: Getting your research, data, or insights published in publications that AI engines weight as authoritative. This overlaps with digital PR and requires either in-house relationships or agency support. Budget $5,000–$15,000/year for consistent placement programs.
Why this is the largest cost driver: AI engines are trained on the entire web. They don’t cite your site because you have good schema; they cite your site because the broader web treats it as authoritative. Building that authority requires consistent, strategic presence across multiple channels. It’s earned media at scale, and earned media requires investment.
AI crawlers require specific data formatting to easily extract, synthesize, and trust your content.
IndexNow and Crawler Management: Submitting content to IndexNow, managing robots.txt permissions dynamically to allow friendly AI bots while protecting proprietary data, and optimizing crawl efficiency. This is relatively low-cost ($1,000–$3,000/year) but critical.
Advanced Schema & Entity Markup: Heavy implementation of JSON-LD (Organization, Product, FAQ, Speakable, Review, and custom schemas) so AI engines instantly understand the relationship between your products, your expertise, and user queries. This includes entity markup that connects your brand to relevant concepts, people, and products. Cost: $3,000–$10,000/year depending on site complexity.
E-E-A-T Signals and Brand Trust Markup: Implementing structured data that communicates Expertise, Experience, Authoritativeness, and Trustworthiness. This includes author bios with credentials, publication dates, update history, and expert credentials. Cost: $2,000–$5,000/year.
Why technical matters, but isn’t the primary driver: Good schema helps AI engines understand your content, but it doesn’t make them cite you. Authority and credibility, built through earned media and third-party validation, are what drive citations. Schema is a prerequisite, not the primary lever.
You’ve got the costs. Now you need the business case. The strongest argument for AI visibility investment is not “we’ll get more traffic”: it’s “we’ll protect against revenue loss and capture upside that competitors are missing.”
Start here, because this is where CFOs listen.
Market shift is real. Gartner predicts a 25% drop in traditional search volume by 2026. SparkToro found that Google lost 3.5 points of U.S. desktop search market share in 2025, with AI search tools absorbing meaningful share. This is not speculation; it’s happening now.
Your competitors are already moving. Forrester explicitly recommends reallocating at least 15% of content or digital spend to AI search visibility. 83% of B2B marketing decision-makers surveyed expect to increase investment in 2026. If you don’t allocate budget now, you’re falling behind.
Traffic loss is accelerating. LinkedIn observed a 60% decline in non-brand organic traffic across a subset of B2B topics. Ahrefs measured click reductions that nearly doubled in eight months. The window to act is closing.
Frame it for your CFO: “We’re protecting against a 25% decline in our primary discovery channel. If we do nothing, we’re accepting a potential 20–30% reduction in organic-driven revenue within 24 months. An AI visibility investment of $60K–$100K is insurance against that loss.”
Once you’ve established the risk, the upside becomes compelling.
AI visitors convert at 4.4× the rate of traditional organic visitors. This is not traffic volume; it’s conversion quality. A visitor who found you through an AI recommendation has already been pre-screened by the AI’s recommendation logic. They’re further down the funnel.
Cited brands see 35% CTR lift over non-cited brands. Being mentioned in an AI’s response drives downstream clicks to your website. The AI answer itself answers the query, but it also drives qualified traffic.
Authority compounds. Once you’re cited in AI responses, you become part of the “consensus” that future AI training data includes. That compounds your visibility over time.
Let’s work through a concrete example. Assume you’re a mid-market SaaS company with a $500K annual SEO budget.
Baseline:
AI visibility allocation:
Impact projection (Year 1):
ROI calculation:
Reality check: That’s an aggressive projection. Let’s use a more conservative scenario.
Conservative scenario (Year 1):
Even conservative projections show 5,500%+ ROI. This is why AI visibility is becoming non-negotiable.
Of course, these numbers assume you’re in a category where AI search is relevant (B2B SaaS, healthcare, professional services, e-commerce). If you’re in a category where AI citations don’t drive buyer decisions, the ROI is lower. But for most B2B and SaaS companies, the math is compelling.
Once you’ve invested, you need to measure. Here’s what matters:
Tier 1 metrics (primary):
Tier 2 metrics (secondary):
Tier 3 metrics (operational):
Report monthly to your team, quarterly to leadership. Use the quarterly reports to justify continued investment and reallocation decisions.
Before you allocate budget, you need to decide how to execute. Each approach has distinct cost, expertise, and control implications.
Pros:
Cons:
Cost: $10K–$30K/year for tools + $60K–$150K/year for headcount (1 FTE). Total: $70K–$180K/year.
Best for: Mid-market companies with existing SEO expertise and budget to hire or train. You’re building a capability, not outsourcing a task.
Execution timeline: 3–6 months to hire and ramp, 6–12 months to see meaningful results.
Pros:
Cons:
Cost: $40K–$100K/year for full-service agency retainer.
Best for: Companies competing in high-intent categories where speed matters. You need results now, not in 6 months.
Execution timeline: 30–60 days to onboard, 3–6 months to see meaningful results.
Pros:
Cons:
Cost: $2,400–$24,000/year for tools + internal staff time.
Best for: Startups and early-stage companies testing the category. You have SEO expertise and want to learn AI visibility before committing to agency spend.
Execution timeline: Immediate access, but 6–12 months to see meaningful results due to execution speed.
| Model | Annual Cost | Expertise Needed | Speed to Results | Control | Scalability | Best For |
|---|---|---|---|---|---|---|
| In-House | $70K–$180K | High | 6–12 months | Full | High (over time) | Mid-market with SEO expertise |
| Agency | $40K–$100K | Low (they have it) | 3–6 months | Medium | Medium | Competitive verticals, need speed |
| Tool-Only | $2.4K–$24K | High | 6–12 months | Full | Low | Startups, testing phase |
Your CFO doesn’t care about schema markup or prompt testing. They care about revenue risk and return on investment. Here’s how to frame the conversation.
Don’t lead with “We’ll optimize our brand for AI.” Lead with “We’re protecting against a 25% drop in our primary discovery channel.”
Talking point 1: “Gartner predicts traditional search volume will drop 25% by 2026. We’re allocating $75K to ensure we capture the share of voice in AI search before competitors lock it in.”
Talking point 2: “LinkedIn observed a 60% traffic decline from AI Overviews, even while rankings stayed stable. Without AI visibility investment, we’re accepting a 20–30% reduction in organic-driven revenue within 24 months.”
Talking point 3: “Our competitors are already allocating 15–30% of their search budgets to AI visibility (per Forrester). We’re behind the curve. This is defensive spend, not discretionary.”
Don’t say: “We’ll optimize 50 pages for AI and implement schema markup.”
Do say: “We’ll add $4–8M in attributed revenue from AI-referred conversions with a 5,500%+ ROI.”
Activity-based arguments sound like overhead. Revenue-based arguments sound like investment. Use the ROI calculator from the previous section to model realistic revenue impact for your company.
CFOs trust benchmarks. Use them.
Talking point 1: “Forrester recommends 15% of content/digital spend to AI visibility. We’re proposing 12% of our $500K search budget = $60K, below industry average.”
Talking point 2: “Mid-market SaaS companies are spending $75K–$150K annually on AI visibility. We’re proposing $75K, in line with peers.”
Talking point 3: “Enterprise companies are allocating $250K–$300K+. We’re starting lean and scaling based on results.”
Don’t ask for the full annual budget upfront. Ask for a phased commitment with clear milestones.
Q1 (Pilot phase): $15K
Q2–Q4 (Execution phase): $45K
Total Year 1 investment: $60K ROI target: 300%+ by month 12, with conservative projections
This structure gives your CFO confidence that you’re testing before scaling, and it gives you flexibility to adjust based on Q1 results.
Slide 1: “The AI Search Shift”
Slide 2: “Our Current Exposure”
Slide 3: “The Risk”
Slide 4: “The Opportunity”
Slide 5: “Our Plan”
Slide 6: “Success Metrics”
Once you’ve secured budget and begun execution, you need a measurement system. Here’s a framework that works.
AI citation rate: What % of AI responses in your category mention your brand? This is your primary KPI.
Share of voice (SOV): Of all citations in your category, what % are yours?
AI-driven conversion rate: What % of visitors from AI search convert?
Branded search lift: Are branded searches increasing? This indicates AI visibility is driving awareness and consideration.
Time-to-first-citation: How long after you publish content does it get cited by AI?
Sentiment in AI responses: Are mentions positive, neutral, or negative?
Content refresh velocity: How many pages are you optimizing per month?
Editorial placement rate: How many third-party placements are you securing per month?
Schema coverage: What % of your site has proper markup?
| Metric | Q1 Baseline | Q2 Target | Q3 Target | Q4 Target | Owner |
|---|---|---|---|---|---|
| AI Citation Rate | 15% | 17% | 19% | 22% | [Name] |
| Share of Voice | 12% | 14% | 16% | 18% | [Name] |
| AI Conversion Rate | 2.0% | 2.8% | 3.5% | 4.2% | [Name] |
| Branded Search Lift | Baseline | +5% | +12% | +20% | [Name] |
| Content Velocity | 3/mo | 5/mo | 8/mo | 10/mo | [Name] |
| Editorial Placements | 1/mo | 2/mo | 3/mo | 4/mo | [Name] |
Monthly: Executive summary (1 page, top 3 metrics)
Quarterly: Full dashboard + insights + reallocation recommendations
Annual: Year-over-year comparison + budget recommendation for next year
Learning from others’ mistakes can save you time, money, and frustration. Here are the most common pitfalls.
The error: Assuming AI visibility is a natural extension of your existing SEO strategy, requiring minimal additional investment.
The reality: AI visibility requires distinct investment in earned media, authority seeding, and schema implementation. It’s not free. It’s not even cheap. It requires dedicated budget and often dedicated expertise.
How to avoid it: Budget for AI visibility as a separate line item, not as an add-on to existing SEO work. Allocate 15–30% of your search budget, not 5%.
The error: Underestimating the required investment and allocating less than 10% of search budget to AI visibility.
The reality: Forrester’s floor recommendation is 15%. Competitive verticals often require 20–30%. Allocating less than 15% means you’re not really competing; you’re just testing.
How to avoid it: Start with at least 15% of search budget. If you have less than $50K to allocate, that’s a signal that your total search budget may be too small.
The error: Tracking AI-driven traffic volume as your primary metric, ignoring conversion rate.
The reality: AI-driven traffic converts at 4.4× the rate of traditional organic. A 20% traffic decline from AI visibility investment can still result in 50%+ revenue growth if conversion rates are higher.
How to avoid it: Track AI-driven conversion rate, not traffic volume. Use UTM tagging or analytics segmentation to isolate AI-referred visitors and measure their conversion behavior.
The error: Focusing budget on tools and technical implementation, underinvesting in earned media and third-party placements.
The reality: 45-65% of your AI visibility budget should go to earned media, meaning citations on Reddit, Quora, industry forums, media publications, and Wikipedia. That’s where AI engines find the credibility signals they use to decide what to cite.
How to avoid it: Allocate 45–65% of budget to earned media and authority seeding. This is not optional; it’s the primary cost driver.
The error: Treating AI visibility as a replacement for traditional SEO, reallocating too much budget away from core SEO work.
The reality: You need both. Keep 70–85% of budget on core SEO (rankings, traffic, traditional organic). AI visibility is additive, not replacement.
How to avoid it: Allocate 15–30% to AI visibility, keep 70–85% on core SEO. Don’t cannibalize your core business to fund an emerging channel.
Arshia is an AI Workflow Engineer at FlowHunt. With a background in computer science and a passion for AI, he specializes in creating efficient workflows that integrate AI tools into everyday tasks, enhancing productivity and creativity.

Am I Cited measures AI citation rate and share of voice across ChatGPT, Perplexity, and Google AI Overview, the core KPIs behind any AI visibility budget request.
A tactical guide to AI visibility resource allocation: team structure, tool spend vs. content spend, platform-specific budgets for ChatGPT, Perplexity, and Gemi...
A researched, verified breakdown of what leading AI visibility and GEO monitoring tools actually cost in 2026, including per-engine fees, seat pricing, and a fr...
A practical framework for sizing your AI visibility budget, deciding what to fund, and building the internal business case — from percentage-of-marketing-budget...
Cookie Consent
We use cookies to enhance your browsing experience and analyze our traffic. See our privacy policy.