


AI Visibility Score
Learn what an AI Visibility Score is and how it measures your brand's presence across ChatGPT, Perplexity, Claude, and other AI platforms. Essential metric for ...
13 min read
Use a weighted scorecard to compare AI visibility tools, spot vendor red flags and evaluate GEO platforms.
The search landscape has fundamentally shifted. Five years ago, SEO was about Google rankings. Today, your customers are asking ChatGPT, Perplexity, and Gemini questions about your industry, and your brand either appears in those AI-generated answers or it doesn’t.
This shift has spawned an entirely new category: AI search visibility tools. But here’s the problem: there are now 30+ platforms claiming to solve this problem, and most are just dashboards. They report metrics without actionable intelligence, monitor a single AI engine when buyers use five, or charge enterprise prices for what amounts to a reporting layer.
Before you spend thousands on an AI visibility tool, you need a framework to separate real platforms from expensive vanity metrics. This article provides exactly that: a weighted scorecard methodology that lets you evaluate any vendor objectively, understand what matters most for your business, and spot red flags before you buy.
One step before the scorecard: if you have never measured your AI presence, run a free AI visibility checker first. Scoring vendors is worth the effort once a free snapshot has shown you there is a gap worth paying to close.

Track how AI chatbots mention your brand across ChatGPT, Perplexity, and other platforms.
AI search visibility tools monitor where your brand appears when users ask AI assistants questions about your industry, product category, or competitors. Unlike traditional SEO rank trackers, which measure search engine results pages (SERPs), these tools measure something fundamentally different: brand mentions and citations within AI-generated answers.
Traditional SEO tools track:
AI visibility tools track:
This distinction matters because AI search operates on a fundamentally different principle. When someone searches Google, they get a list. When they ask ChatGPT, they get a synthesized answer that cites sources. Visibility is no longer about ranking position: it’s about being cited as a trusted source.
According to Princeton-led research on generative engine optimization (GEO), AI platforms synthesize answers from multiple sources. If your brand never appears in those synthesis processes, you’re invisible to an increasingly large segment of your audience. Studies show that:
If you’re not tracking AI visibility today, you’re flying blind on a critical customer journey.
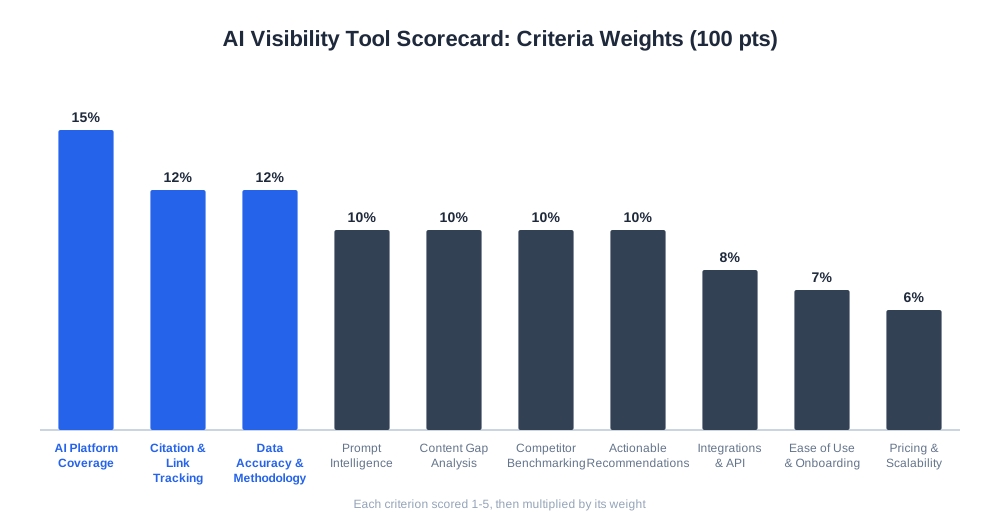
Evaluating an AI visibility tool should not be a guessing game. Use this weighted scorecard framework to compare vendors objectively. Each criterion is weighted based on how much it impacts your ability to measure visibility accurately and act on those insights.
Total possible score: 100 points
What to evaluate: Does the tool monitor all major AI engines your audience uses, or just a subset? Can you see visibility metrics broken down by engine?
Why it matters: Different AI platforms cite different sources. ChatGPT heavily weights OpenAI-trained data and popular websites. Perplexity prioritizes real-time web data. Gemini integrates Google’s Knowledge Graph. Claude has its own training biases. If a tool monitors only ChatGPT, you’re missing 60% of the AI search landscape.
Scoring criteria (1–5):
Red flag: A tool that claims to monitor “all AI” but only provides a blended score. You need granular data.
Questions to ask vendors:
What to evaluate: Does the tool identify exactly which sources AI cites? Does it preserve links? Can you see citation frequency and position within answers?
Why it matters: A citation without a link is worthless. You want to know: “Did the AI mention us? Did it link to our site? Where in the answer did it appear, first sentence or buried in a list? That is the difference between visibility and actionability.
Scoring criteria (1–5):
Red flag: Tools that report “citations” but don’t show you the actual links or sources.
Questions to ask vendors:
What to evaluate: How does the tool collect data? How often are prompts rerun? How does it handle AI response variability?
Why it matters: AI responses are inherently variable. Run the same prompt to ChatGPT twice, and you might get slightly different answers. Some tools run a prompt once and call it definitive. Others run it 10 times and average the results. This difference is massive for data reliability.
Scoring criteria (1–5):
Red flag: “We run prompts once per week and report exact visibility scores.” This is a sign the vendor doesn’t understand AI variability.
Questions to ask vendors:
What to evaluate: Can you customize prompts? Does the tool understand intent and buyer journey stages? Can it transform keywords into realistic user prompts?
Why it matters: “AI search visibility tool” is not how your customers search. They ask questions like “Which tool should I use to monitor AI citations?” or “How do I improve my brand visibility in ChatGPT?” A tool that only tracks your branded keywords is useless. Great tools transform SEO keywords into natural, buyer-intent prompts.
Scoring criteria (1–5):
Red flag: Tools that track only your brand name and product keywords.
Questions to ask vendors:
What to evaluate: Does the tool identify why you’re not cited? Does it recommend specific content, schema, or technical fixes?
Why it matters: Visibility metrics without a path to improvement are useless. The best tools don’t just report “you were cited in 3 of 10 prompts”; they explain why and recommend fixes. Example: “AI didn’t cite you for ‘AI visibility tool pricing’ because your pricing page lacks schema markup. Add FAQPage schema to improve citations by an estimated 40%.”
Scoring criteria (1–5):
Red flag: “Your visibility is low. Create more content.” That’s not actionable.
Questions to ask vendors:
What to evaluate: Can you track competitor visibility? Can you see which prompts they win and you lose?
Why it matters: Visibility in isolation is meaningless. You need context: “I’m cited in 5 of 10 prompts, is that good or bad?” Benchmarking against competitors answers this. It also reveals which prompts/keywords are most valuable (where competitors are winning).
Scoring criteria (1–5):
Red flag: Tools that don’t offer competitor tracking at all.
Questions to ask vendors:
What to evaluate: Does the tool recommend specific actions? Are recommendations automatically generated or manually curated? Do they integrate with your content workflow?
Why it matters: The difference between a good tool and a great one is whether it tells you what to do. “You were cited 40% less this month” is a metric. “Rewrite your pricing page to address objections about cost vs. feature set (mentioned in 8 of 10 competitor answers)” is actionable.
Scoring criteria (1–5):
Red flag: “We provide insights, not recommendations.” This is a reporting tool, not a strategy tool.
Questions to ask vendors:
What to evaluate: Does the tool integrate with your existing stack (CMS, analytics, marketing automation, SEO tools)?
Why it matters: A tool that lives in isolation creates extra work. You want to pull data into Google Analytics, push recommendations to your CMS, or integrate with Slack for alerts. API access and native integrations matter.
Scoring criteria (1–5):
Red flag: No API or integrations. You’ll spend hours manually copying data.
Questions to ask vendors:
What to evaluate: How intuitive is the dashboard? How long is the learning curve? How responsive is customer support?
Why it matters: A powerful tool is useless if your team can’t figure out how to use it. You also need responsive support when questions arise.
Scoring criteria (1–5):
Red flag: No documentation or support contact information.
Questions to ask vendors:
What to evaluate: Is pricing transparent? What’s included at each tier? How does pricing scale as you add more prompts or users?
Why it matters: Some tools charge per prompt, others per brand, others per user. Some have hidden credit consumption that makes costs unpredictable. You need to understand total cost of ownership.
Scoring criteria (1–5):
Red flag: “Contact us for pricing” with no transparency.
Questions to ask vendors:
Get the latest insights on AI mentions, brand monitoring, and optimization strategies.
Calculate your total weighted score using the formula:
Total Score = (Criterion Score × Weight) + (Criterion Score × Weight) + … [for all 10 criteria]
90–100: Enterprise-Ready (Green Light)
75–89: Solid Choice (Yellow Light)
60–74: Good for Monitoring, Limited for Strategy (Caution)
Below 60: Hard Pass (Red Light)
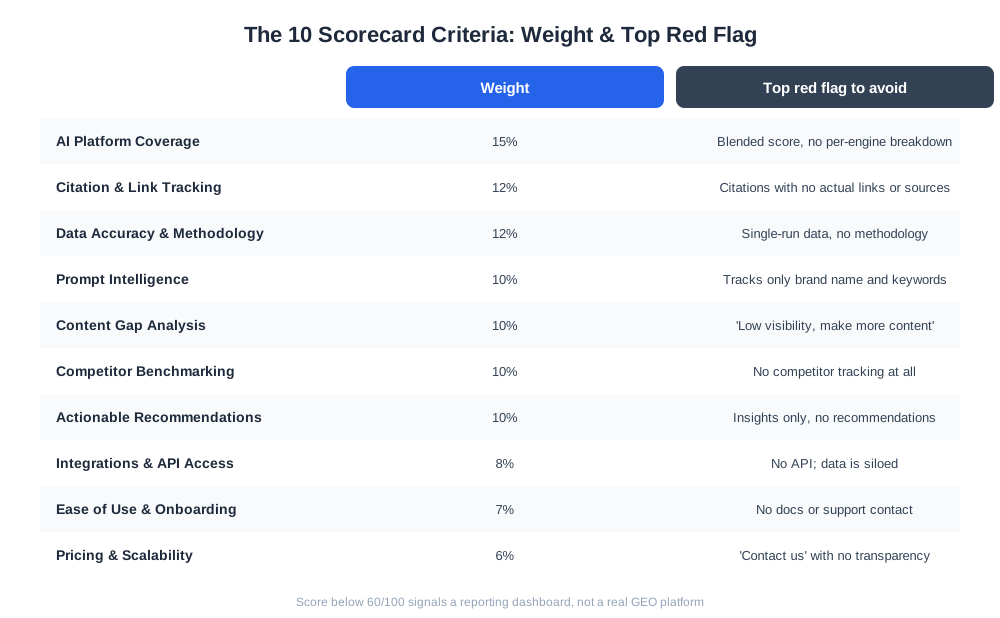
Before signing a contract, watch for these warning signs:
What it looks like: “Your AI Visibility Score is 73/100”
Why it’s dangerous: You have no idea how this score was calculated. Is it weighted toward ChatGPT? Does it account for competitor benchmarking? Without transparency, you can’t improve it strategically.
What to do instead: Look for tools that break down visibility by engine, prompt, and metric. You should see: “ChatGPT: 8 citations / 10 prompts. Perplexity: 6 citations / 10 prompts. Gemini: 4 citations / 10 prompts.”
What it looks like: “We track ChatGPT visibility”
Why it’s dangerous: ChatGPT is important, but it’s not the only AI your audience uses. Perplexity is growing 300% year-over-year. Gemini is integrated into Google. If you’re only tracking ChatGPT, you’re missing critical visibility gaps.
What to do instead: Require multi-engine monitoring. Non-negotiable.
What it looks like: Vendor can’t or won’t explain how they select prompts or how often they run them.
Why it’s dangerous: Without knowing the methodology, you can’t trust the data. Are they running prompts once per week? Once per month? Are prompts representative of real user behavior?
What to do instead: Ask for a detailed methodology document. If they won’t provide one, walk away.
What it looks like: The tool only shows your visibility, not your competitors’.
Why it’s dangerous: Visibility in isolation is meaningless. You need context.
What to do instead: Competitor benchmarking should be table stakes. It’s not an “advanced feature.”
What it looks like: “You were cited 40% less this month” with no explanation or recommendations.
Why it’s dangerous: Metrics without a path to improvement are just noise. You’re paying for a dashboard, not a strategy tool.
What to do instead: Vendors should be able to explain why visibility changed and what to do about it.
What it looks like: “Starting at $99/month” but unclear what’s included or how credits work.
Why it’s dangerous: You might sign up for $99/month and end up paying $500/month in overages.
What to do instead: Get a written proposal with transparent pricing, credit consumption, and overage costs. Ask for a cost estimate based on your specific use case.
What it looks like: Vendor refuses to let you test before paying.
Why it’s dangerous: You’re buying blind. The tool might not work with your prompts, integrate with your stack, or deliver the insights you need.
What to do instead: Insist on a 14–30 day free trial or a low-cost proof-of-concept period.
Based on the evaluation framework above, here’s how the leading platforms stack up. Run each one through the scorecard yourself before you commit budget, since your platform mix and priority criteria will shift the ranking.
Strengths:
Weaknesses:
Best for: Teams who want the specific criteria this scorecard prioritizes (per-engine transparency, competitor benchmarking, actionable recommendations) without paying for enterprise features they won’t use.
Overall Score: 92/100
Strengths:
Weaknesses:
Best for: Enterprise teams, agencies, competitive verticals where GEO is mission-critical.
Pricing: Custom enterprise pricing; typically $2,000–10,000+/month depending on scale.
Overall Score: 88/100
Strengths:
Weaknesses:
Best for: European teams, agencies, organizations prioritizing data transparency and compliance.
Pricing: Mid-market pricing; typically $500–2,000/month.
Overall Score: 85/100
Strengths:
Weaknesses:
Best for: Content-first teams, high-volume content operations, teams wanting monitoring + creation in one platform.
Pricing: Mid-market pricing; typically $300–1,500/month.
Overall Score: 82/100
Strengths:
Weaknesses:
Best for: Teams focused primarily on citation tracking, SMBs wanting to start with a free tier.
Pricing: Freemium model; paid plans start at $99/month.
Overall Score: 81/100
Strengths:
Weaknesses:
Best for: Teams wanting to measure AI visibility ROI, teams prioritizing workflow integration.
Pricing: Mid-market pricing; typically $500–2,500/month.
Overall Score: 79/100
Strengths:
Weaknesses:
Best for: Teams already invested in Semrush, teams wanting SEO + GEO in one platform.
Pricing: Semrush pricing; typically $120–450/month for SEO; GEO adds $50–200/month.
Overall Score: 78/100
Strengths:
Weaknesses:
Best for: Agencies managing multiple client accounts, teams needing deep research support.
Pricing: Agency-focused pricing; typically $400–1,500/month.
Overall Score: 76/100
Strengths:
Weaknesses:
Best for: Content teams, teams prioritizing content optimization over pure monitoring.
Pricing: Mid-market pricing; typically $200–1,200/month.
Once you’ve selected a tool using the scorecard framework, here’s how to implement it successfully:
Step 1: Run a Proof-of-Concept
Step 2: Evaluate Integrations
Step 3: Calculate Expected ROI
Step 4: Get Team Buy-In
Step 1: Set Up Accounts & Integrations
Step 2: Define Your Prompt Strategy
Step 3: Run Initial Baseline
Step 4: Train Your Team
Step 1: Identify Quick Wins
Step 2: Execute Content Updates
Step 3: Monitor & Iterate
Step 4: Measure Business Impact
Step 1: Expand Prompt Coverage
Step 2: Deepen Competitive Intelligence
Step 3: Integrate with Broader Strategy
The myth: Run a prompt once, and you know your visibility.
The reality: AI responses are variable. Run the same prompt to ChatGPT twice, and you might get slightly different answers. Some answers cite you; others don’t. This variability is why sampling matters.
What to do: Look for tools that run prompts 5–10+ times and report confidence intervals or ranges, not single-point estimates.
The myth: AI search visibility is the future; traditional SEO is dead.
The reality: SEO and GEO are complementary. AI tools cite sources from Google search results. If you don’t rank on Google, you won’t be cited by AI. GEO is an addition to SEO, not a replacement.
What to do: Invest in both. Prioritize SEO fundamentals first, then layer GEO on top.
The myth: AI visibility tools all monitor ChatGPT, Perplexity, and Gemini.
The reality: Engine coverage varies wildly. Some tools monitor only ChatGPT. Others track 6+ engines. Coverage determines the completeness of your visibility picture.
What to do: Require multi-engine monitoring. Verify which specific engines are supported before buying.
The myth: The quoted price is what you’ll pay.
The reality: Many tools charge per prompt, per brand, or per user, with hidden overage costs. A $99/month tool can easily become $500/month if you underestimate prompt volume.
What to do: Get a written proposal with transparent pricing and overage costs. Ask for a cost estimate based on your specific use case (number of prompts, brands, users).
The myth: Enterprise tools are always better.
The reality: Price reflects feature set and support, not necessarily quality. A $2,000/month tool might be perfect for enterprise teams but overkill for SMBs. A $300/month tool might cover 90% of your needs.
What to do: Use the scorecard framework. Score each tool objectively and choose based on your specific needs, not price.
The myth: A single AI visibility tool is sufficient.
The reality: Many teams use multiple tools: one for monitoring, one for competitor intelligence, one for content recommendations. Tools have different strengths.
What to do: Use the scorecard to identify which tools excel in areas critical to your strategy, then combine them.
Arshia is an AI Workflow Engineer at FlowHunt. With a background in computer science and a passion for AI, he specializes in creating efficient workflows that integrate AI tools into everyday tasks, enhancing productivity and creativity.

Am I Cited shows exactly which platforms cite you, how often, and how that compares to competitors, across ChatGPT, Perplexity, and Google AI Overview.
Learn what an AI Visibility Score is and how it measures your brand's presence across ChatGPT, Perplexity, Claude, and other AI platforms. Essential metric for ...

What an AI visibility score actually represents, why it matters more every quarter, and the concrete tactics that move it — content, technical, and monitoring....

Compare your AI citations across ChatGPT, Gemini, Perplexity and Google AI in the AmICited platform breakdown.
Cookie Consent
We use cookies to enhance your browsing experience and analyze our traffic. See our privacy policy.