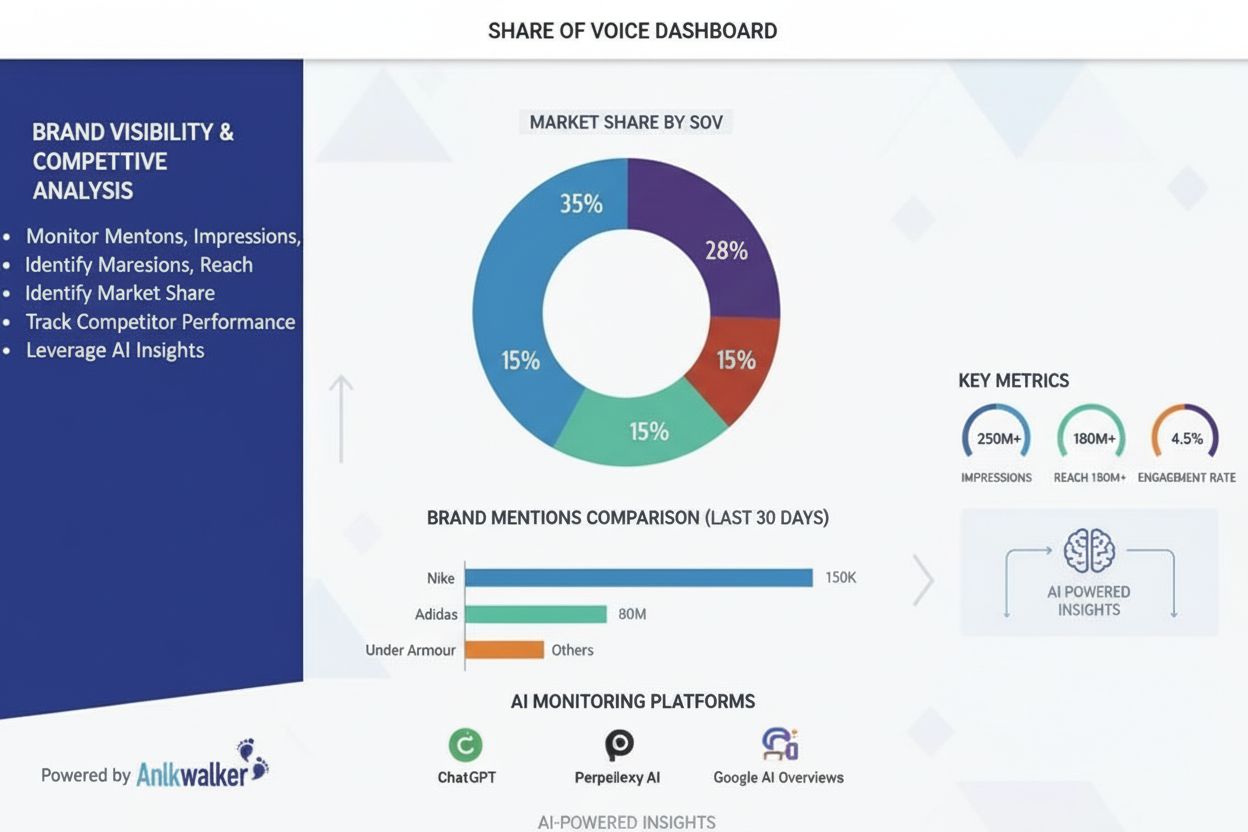
Share of Voice
Share of Voice measures brand visibility compared to competitors across marketing channels. Learn how to calculate SOV, track it across AI platforms, and increa...
11 min read
Share of Search is the percentage of organic search queries made for a specific brand compared to the total search volume for all competing brands within the same industry category. It serves as a leading indicator of brand awareness, market positioning, and future market share growth.
Share of Search is the percentage of organic search queries made for a specific brand compared to the total search volume for all competing brands within the same industry category. It serves as a leading indicator of brand awareness, market positioning, and future market share growth.
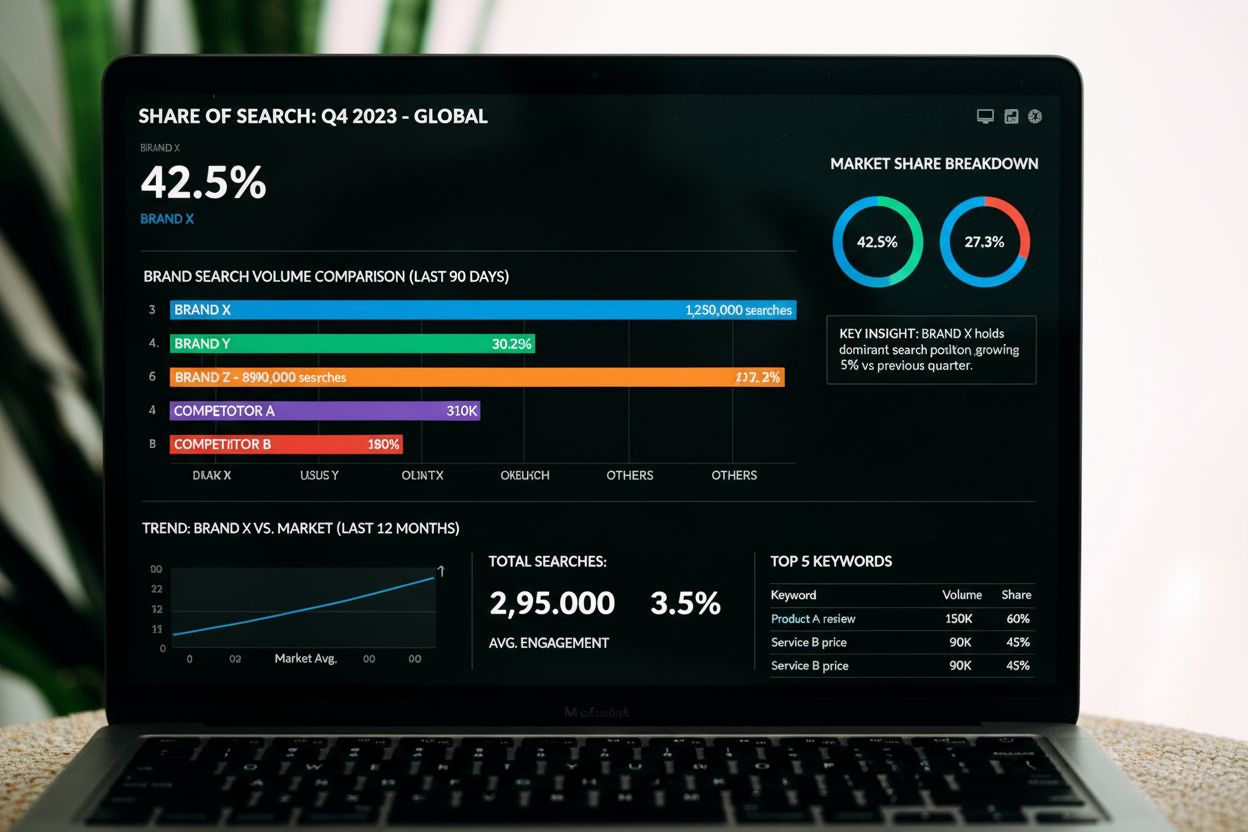
Share of Search is the percentage of organic search queries made for a specific brand compared to the total search volume for all competing brands within the same industry category. This metric quantifies a brand’s digital presence relative to competitors by measuring how frequently consumers search for your brand name versus alternative options in your market. Unlike traditional market share metrics that rely on sales data, Share of Search uses readily available search volume information to provide a real-time snapshot of brand visibility and consumer interest. The metric has emerged as one of the most predictive indicators of future market performance, with research demonstrating an 83% correlation between Share of Search and actual market share growth across multiple industries.
The concept of Share of Search evolved from traditional Share of Voice metrics, which marketers used for decades to measure advertising effectiveness by comparing media spend across competitors. However, as digital advertising fragmented across countless platforms—from programmatic display to social media to retail media networks—calculating accurate Share of Voice became increasingly impossible. Researchers and industry leaders, particularly advertising effectiveness expert Les Binet, recognized that search query data provided a more reliable and accessible alternative. Research published by the Institute of Practitioners in Advertising validated this approach, demonstrating that Share of Search could predict market share movements up to 12 months in advance. This discovery transformed how brands approach competitive analysis and marketing measurement, shifting focus from advertising spend to actual consumer behavior signals captured through search engines.
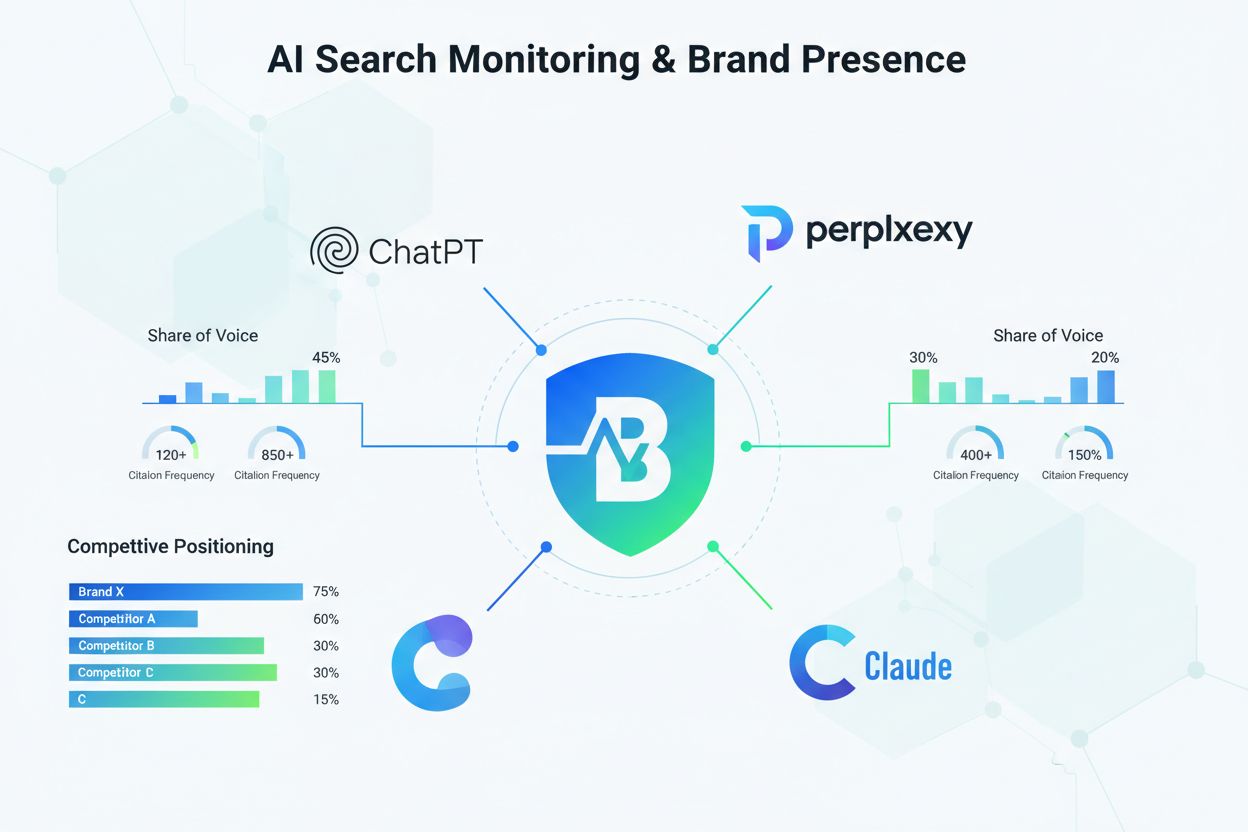
Track how AI chatbots mention your brand across ChatGPT, Perplexity, and other platforms.
The calculation of Share of Search follows a straightforward formula: divide the number of organic searches for your brand by the total number of searches for all brands in your category, then multiply by 100 to express as a percentage. For example, if Brand A receives 120,000 searches, Brand B receives 90,000, Brand C receives 50,000, and Brand D receives 75,000, Brand A’s Share of Search would be 120,000 ÷ (120,000 + 90,000 + 50,000 + 75,000) × 100 = approximately 36%. However, accurate calculation requires careful consideration of several factors. Brands must identify all relevant competitors within their category, account for ambiguous brand names that may generate irrelevant search results, include related product searches that consumers may not explicitly associate with the brand name, and continuously update keyword lists as new products and campaigns launch. Advanced Share of Search analysis, as demonstrated by research firms like Kantar, can expand from a handful of branded keywords to 30,000+ related search terms, revealing a 36% increase in search interest that basic calculations miss.
| Metric | Definition | Data Source | Calculation Ease | Predictive Power | Industry Applicability |
|---|---|---|---|---|---|
| Share of Search | Percentage of brand searches vs. total category searches | Google Trends, SEO tools | Easy (free tools available) | Very High (83% correlation to market share) | Universal across all industries |
| Share of Voice | Percentage of advertising spend vs. total category spend | Media databases, proprietary data | Difficult (fragmented data) | Moderate (outdated metric) | Traditional media-focused industries |
| Market Share | Percentage of sales revenue vs. total category revenue | Financial reports, industry data | Difficult (private data) | Retrospective only | All industries |
| Brand Awareness | Percentage of target audience familiar with brand | Survey research | Moderate (requires surveys) | Moderate (lagging indicator) | Consumer-focused industries |
| Search Volume | Total number of searches for a keyword | Google Trends, SEO tools | Easy (free tools available) | Low (absolute number, not relative) | All industries |
| AI Share of Voice | Frequency of brand citations in AI search results | AI monitoring tools | Moderate (specialized tools) | High (emerging metric) | All industries (growing importance) |
Get the latest insights on AI mentions, brand monitoring, and optimization strategies.
One of the most compelling aspects of Share of Search is its ability to predict future market performance. Research by Les Binet across automotive, insurance, restaurant, and CPG industries demonstrates that changes in Share of Search precede changes in actual market share by 6-12 months. In the automotive industry, for instance, when Ford’s Share of Search declined by 10%, Ford’s market share followed with a similar decline within the subsequent year. This predictive capability stems from the fundamental consumer behavior principle that people search for brands they intend to purchase or already own. When Share of Search increases, it signals rising consumer consideration and intent, which eventually converts to sales. The 83% correlation between Share of Search and market share across diverse industries and geographies makes this metric invaluable for strategic planning. Brands can use Share of Search trends as an early warning system, identifying competitive threats or opportunities months before they manifest in revenue reports. This forward-looking capability distinguishes Share of Search from retrospective metrics like market share, which only reveal what has already occurred.
The emergence of Large Language Models (LLMs) and AI-powered search tools has fundamentally expanded the relevance of Share of Search monitoring. Traditional Share of Search focuses on Google Search Engine Results Pages (SERPs), but consumers increasingly discover information through ChatGPT, Perplexity, Google AI Overviews, Claude, and other AI systems. These platforms generate search results differently than traditional SERPs, often providing synthesized answers that cite multiple sources or none at all. This shift has created a new dimension of Share of Search measurement: AI Share of Voice, which tracks how frequently a brand is cited or mentioned in AI-generated responses. Research indicates that AI search traffic is expected to surpass traditional organic search by 2028, making AI visibility increasingly critical. Brands must now monitor both traditional Share of Search in Google SERPs and their citation frequency across AI platforms. Platforms like AmICited enable brands to track their Share of Search equivalents across multiple AI systems simultaneously, providing comprehensive visibility into how their brand appears across the entire search ecosystem. This dual-channel monitoring approach ensures brands maintain competitive positioning as consumer search behavior continues to evolve.
Share of Search serves multiple strategic purposes across marketing, product development, and competitive intelligence functions. For marketing teams, Share of Search provides a quantifiable metric to measure the effectiveness of brand awareness campaigns, including TV advertising, digital PR, influencer partnerships, and content marketing initiatives. When brands launch upper-funnel awareness campaigns, Share of Search typically increases within weeks, providing faster feedback than traditional sales metrics. For product teams, Share of Search reveals which products and features consumers actively seek, informing product roadmap decisions and feature prioritization. For competitive intelligence, Share of Search benchmarking against competitors identifies market positioning gaps and opportunities. Brands can identify which competitors are gaining or losing consumer interest, understand category-level search trends, and adjust strategies accordingly. For example, when a competitor launches a new product that generates significant search interest, brands can observe this shift in Share of Search and respond with competitive content or product offerings. The metric also helps brands understand geographic variations in competitive positioning, as Share of Search can be calculated by region, revealing where brands have strong or weak market presence.
Brands can measure Share of Search using both free and premium tools, each offering different levels of precision and functionality. Google Trends provides free, accessible Share of Search data by allowing users to compare search interest for multiple brands over time, though the data is relative rather than absolute. Semrush’s Keyword Overview tool offers more precise monthly search volume data, enabling exact Share of Search calculations across competitors. Kantar’s BrandDigital platform provides enterprise-grade Share of Search analysis with sophisticated keyword expansion and ambiguity correction. For AI-focused Share of Search monitoring, Semrush’s AI Visibility Toolkit tracks brand citations across major LLM platforms including ChatGPT, Perplexity, Google AI Overviews, and Claude. AmICited specializes in comprehensive AI monitoring, tracking brand mentions across multiple AI systems and providing competitive benchmarking. The choice of tool depends on organizational needs, budget, and required precision. Small businesses may start with free Google Trends data, while enterprises typically invest in comprehensive platforms that integrate traditional and AI Share of Search monitoring with competitive intelligence and market analysis capabilities.
While Share of Search is a powerful metric, several limitations warrant consideration. Brands with common names or names that are also everyday words face challenges in accurate measurement, as search volume includes irrelevant queries. For example, “Dodge” searches include both the automotive brand and the verb “dodge,” requiring careful keyword filtering. Similarly, brands whose products have become category synonyms—like Kleenex for tissues—may undercount search volume if consumers search for the generic term instead of the brand name. Share of Search also doesn’t capture direct traffic, where consumers navigate directly to a brand’s website without searching, potentially underestimating brand strength for established brands with loyal customer bases. Additionally, Share of Search reflects search behavior but not necessarily purchase intent; consumers may search for a brand out of curiosity or to access existing accounts rather than to make purchases. Geographic and temporal variations in search behavior can also skew Share of Search calculations if not properly segmented. Finally, Share of Search measures relative positioning but not absolute market opportunity; a brand could have high Share of Search in a declining category or low Share of Search in a rapidly growing market, requiring contextual analysis alongside the metric itself.
The future of Share of Search measurement is evolving rapidly as search behavior continues to shift toward AI-powered discovery. Traditional Share of Search will remain relevant for years, but its importance will gradually diminish as AI search captures increasing market share. The emerging metric of AI Share of Voice—measuring brand citation frequency in AI-generated responses—will become equally or more important than traditional Share of Search for competitive positioning. Advanced AI monitoring platforms will likely integrate Share of Search data across multiple channels, providing unified dashboards that show brand visibility across Google SERPs, AI platforms, social media, and emerging discovery channels. Predictive analytics will enhance Share of Search utility by forecasting future trends based on historical patterns and real-time signals. Natural language processing improvements will enable more sophisticated Share of Search analysis, automatically identifying and categorizing related search terms without manual keyword expansion. Integration with customer data platforms will allow brands to correlate Share of Search movements with actual customer behavior, sales, and lifetime value, strengthening the metric’s predictive power. As competition for visibility intensifies across fragmented search channels, Share of Search monitoring—encompassing both traditional and AI platforms—will become a fundamental component of brand strategy, competitive intelligence, and marketing measurement for organizations across all industries.
Start tracking how AI chatbots mention your brand across ChatGPT, Perplexity, and other platforms. Get actionable insights to improve your AI presence.
Share of Voice measures brand visibility compared to competitors across marketing channels. Learn how to calculate SOV, track it across AI platforms, and increa...

Learn how to calculate Share of Voice for AI search platforms. Discover the formula, tools, and strategies to measure your brand's visibility in ChatGPT, Perple...
Learn how to measure and improve your brand's share of voice in AI search across ChatGPT, Perplexity, Gemini, and other AI platforms. Complete guide with metric...
Cookie Consent
We use cookies to enhance your browsing experience and analyze our traffic. See our privacy policy.