
Ask an AI search engine “which brand makes the best running shoes?” today, and you’ll get an answer. Ask the exact same question tomorrow, or even five minutes from now, and roughly two-thirds of the sources it cites will be different. That’s not a glitch. It’s how AI search works.
What you’ll get from this guide:
- Why AI search visibility behaves like a probability, not a fixed ranking the way Google does
- A plain-English explainer of how researchers measure whether an AI answer actually changed (Jaccard and RBO)
- Six data-backed findings, each with its own chart: source churn, brand stability, citation concentration, model randomness, engine differences, and prompt sensitivity
- The exact numbers that matter: how many repeated runs per prompt, and how long an observation window, you need for trustworthy data
- A copy-and-use checklist for setting up GEO measurement you can actually rely on
- FAQs covering runs, windows, engines, and metrics
A new academic study makes this uncomfortably concrete. In “Don’t Measure Once: Measuring Visibility in AI Search (GEO)” (arXiv, April 2026), researchers Julius Schulte, Malte Bleeker, and Philipp Kaufmann at the University of St. Gallen (with Aurora Intelligence) tracked four AI search engines across four industries every day for six-plus weeks. Their finding: AI-search visibility is probabilistic, not deterministic. A single query is an unreliable snapshot, and treating it like a Google ranking will lead you to the wrong conclusions. It’s one of a fast-growing body of academic research on GEO reshaping how marketers think about AI visibility.
For marketers, this matters more than it might sound. If you check whether your brand shows up in ChatGPT or Perplexity once and call it a “measurement,” you could be over- or under-estimating your true presence by a wide margin. The fix isn’t a better single query; it’s a different mental model. You have to measure visibility as a distribution: many runs, many prompts, over a sustained window.
Below, we walk through exactly what the study found, why AI search behaves this way, and how many measurements you actually need before your numbers mean anything.
TL;DR (what the study found):
- Cited sources churn hard. Only about 34-42% of the sources an AI engine cites carry over from one day to the next, meaning roughly 65% of sources change daily.
- Brand mentions are steadier, but still volatile. Day-to-day brand overlap runs 45-59%, more reliable than individual URLs but far from stable.
- Citations are highly concentrated. A handful of domains capture most of the visibility. The mean Gini coefficient is 0.715, and on a 0-to-1 scale where 1 means a single domain hoards every citation, that’s a very lopsided landscape.
- It’s the model’s own randomness, not the news. Firing the identical prompt multiple times on the same day produces the same churn, so most instability comes from the model itself, not real-world change.
- One run tells you almost nothing. You need at least 7 runs per prompt per day for a trustworthy brand-visibility estimate, and 8 if you also track individual source URLs.
- Short windows lie. Because sources turn over so fast, you need a rolling 2 to 4 week window to get a stable read on a brand’s true visibility.
Key Takeaways
- A 2026 University of St. Gallen study found only about 34-42% of cited sources overlap between consecutive days, so a single AI-search query is an unreliable snapshot, not a stable ranking.
- The instability comes from the model’s own randomness, not the news cycle: firing the identical prompt up to 10 times on the same day produced the same low overlap as day-to-day comparisons.
- Reliable brand-visibility measurement needs at least 7 runs per prompt per day (8 for source-level tracking) and a rolling 2 to 4 week observation window.
- Citations are highly concentrated (mean Gini coefficient 0.715), so AI visibility in most niches is a winner-take-most game, and the four engines tested behave differently enough that you need separate baselines for each.
- Bottom line: Stop measuring AI visibility with one-off checks and start tracking it as a distribution across repeated runs and engines, which is exactly the kind of continuous, multi-run monitoring a platform like amicited automates.
Why AI Search Visibility Doesn’t Behave Like Google Rankings
If you come from SEO, your instincts are calibrated to a world that no longer applies. In classic search, results are ranked and mostly stable: your page sits at position 4 today and probably position 4 or 5 tomorrow. A single check gives you a fair snapshot, and when things move, they move gradually along a predictable spectrum. You can watch your position drift and react.
Generative Engine Optimization (GEO) doesn’t work that way. GEO is all-or-nothing, what the paper calls a binary inclusion-exclusion dynamic. In any given answer, your brand or source is either woven in prominently or left out entirely. There’s no “position 8” consolation. You’re either in the answer or you’re invisible, and which of those you get can flip from one run to the next, driven by the probabilistic way large language models generate text and select evidence.
That volatility is compounded by a second problem: an AI search engine is a black box. You can’t see why your brand was included in one response and dropped in the next. The model compresses information from many sources into a short, constrained answer, and the selection process isn’t transparent or reproducible. Unlike an SEO ranking, which oscillates within a visible ranking set, AI visibility can vanish without warning or explanation.
Compounding both is a missing tool. In SEO, marketers have Google Search Console, a first-party utility that tells you which queries you appear for and how often. The LLM providers offer no equivalent. Basic facts like how often people actually ask a given question simply can’t be seen in the GEO ecosystem. That blind spot is exactly why marketers have to build measurement from the outside, through repeated third-party sampling, and why a single, static “visibility” number is so easy to misread. The rest of this post is about doing that measurement correctly.

Ready to Monitor Your AI Visibility?
Track how AI chatbots mention your brand across ChatGPT, Perplexity, and other platforms.
Inside the Study: What the Researchers Actually Did
The study is refreshingly concrete, so it’s worth understanding the setup before trusting the numbers. Researchers at the University of St. Gallen (working with Aurora Intelligence) built a monitoring harness that queried four AI search engines every single day and recorded exactly which sources and brands each one returned.
They tested four engines: ChatGPT, Google Gemini, Google AI Mode, and Perplexity. Each engine was asked the same set of questions across four real-world verticals (the paper calls them “campaigns”) chosen because they get heavy search traffic in the Swiss market: Consumer Electronics, Real Estate Sales, Sporting Goods, and Telecommunications.
For each vertical, the team wrote 8 prompts, and here’s a smart detail: the prompts weren’t invented. They pulled high-volume SEO keywords, typed them into Google, and lifted the actual questions from Google’s “People Also Ask” box. That means the questions look like what real people ask: conversational, top-of-funnel queries such as “Which brand makes good running shoes?” rather than bare keywords.
The engines were queried daily over a 45 to 46 day window (January 24 to March 20, 2026) from servers based in Switzerland, which matters for how the AI personalizes results. In total, the analysis covered 4,044 consecutive-day pairs, every “today vs. tomorrow” comparison across all engines, prompts, and verticals.
Here’s the design at a glance:
| Design element | What they used |
|---|---|
| AI engines | 4 (ChatGPT, Gemini, Google AI Mode, Perplexity) |
| Verticals / campaigns | 4 (Consumer Electronics, Real Estate, Sporting Goods, Telecom) |
| Prompts per vertical | 8 |
| Observation window | 45 to 46 days (Jan 24 to Mar 20, 2026) |
| Source of prompts | Google “People Also Ask” |
This is a lot of repeated measurement, which is exactly the point the paper is trying to make.
Two Simple Ways to Measure “Did the Answer Change?”
To ask “how much did today’s answer differ from yesterday’s?”, the researchers needed a way to score two lists against each other. They used two metrics, and you don’t need any statistics background to follow them.
Jaccard similarity just asks: of all the sources that showed up across both days, how many appeared on both days? You count the sources they share, then divide by the total number of unique sources across the two days.
Here’s a tiny example. Say today’s answer cites 5 sources and tomorrow’s also cites 5, but only 2 of them are the same. The two answers share 2 sources, and between them they mention 8 distinct sources (5 + 5, minus the 2 counted twice). So the Jaccard score is 2 ÷ 8 = 0.25, meaning only about a quarter of the sources held steady, and roughly three-quarters churned overnight. A Jaccard of 1.0 would mean identical lists; 0.0 would mean no overlap at all.
Rank-Biased Overlap (RBO) asks the same question but adds one thing Jaccard ignores: order. Being cited first is worth more than being cited fifth, so RBO gives extra weight to the top of the list. Because it demands that shared items appear in similar positions (not just that they’re present somewhere), RBO is always the stricter of the two. That’s why in this study RBO comes out lower than Jaccard across the board.
How to read these numbers:
- Higher = more stable. A score near 1.0 means the answer barely changed; near 0 means it was almost entirely reshuffled.
- Jaccard answers “are the same items present?”
- RBO answers “are the same items present and in the same order?”
- The gap between them tells you how much the ranking is churning, even when the same items keep showing up.
If you want to see how these fit alongside other yardsticks, our guide to the 10 important AI visibility metrics puts overlap scores in context with the rest of your monitoring dashboard.
Stay Updated on AI Visibility Trends
Get the latest insights on AI mentions, brand monitoring, and optimization strategies.
Finding #1: Two-Thirds of Cited Sources Change Every Single Day
If AI search worked like Google, asking the same question two days in a row would surface roughly the same pages. It does not. When the St. Gallen researchers tracked which sources four AI engines cited every day for a month and a half, they found that the list of cited sources reshuffles almost completely from one day to the next.
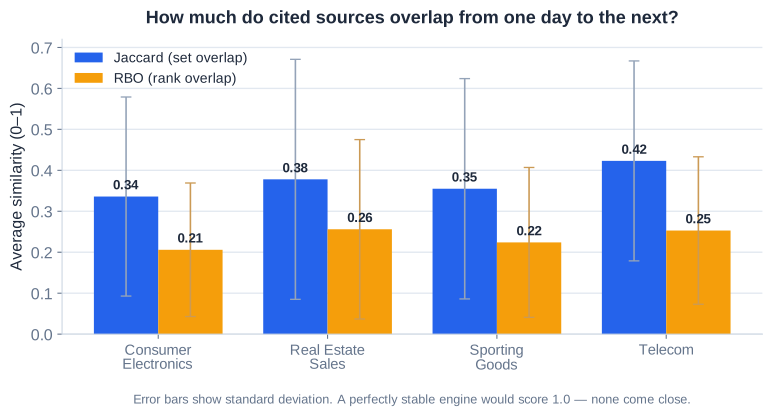
The headline number is Jaccard, the share of cited sources present on both days. Across the four verticals it ranged from just 0.336 for Consumer Electronics to 0.423 for Telecommunications, with Sporting Goods at 0.355 and Real Estate Sales at 0.378. In plain English, a Jaccard of 0.35 means only about 35% of cited sources are the same the next day, so roughly 65% of the sources churn out and get replaced every single day. Telecom was the steadiest of the bunch, and Consumer Electronics the most volatile, but none of them came close to stable.
It gets worse when you account for ranking. RBO, which weights the top of the list most heavily, landed between 0.21 and 0.26, noticeably lower than Jaccard. That gap is telling. It means it is not just which sources appear that changes day to day; the order in which they appear shuffles too. Even the handful of sources that do survive to the next day often move around, so the “top” citation you saw yesterday may be buried today.
This is exactly the churn we have written about before in the 7% overlap problem: a single query is a snapshot of a moving target. Check your AI citations once and log the result, and you have captured one frame of a distribution that reshuffles by tomorrow morning.
Finding #2: Brand Mentions Are Steadier, But Still Far From Stable
Individual URLs churn wildly, but marketers usually care about something coarser: is my brand getting mentioned at all? Aggregating up from specific sources to brand names smooths out a lot of the noise, yet even at the brand level, the day-to-day picture is far from the stable ranking you would expect from traditional search.
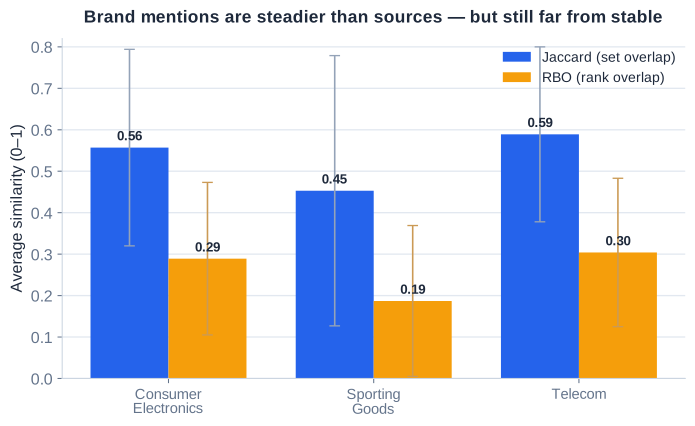
Brand-level Jaccard landed between 0.45 and 0.59, meaningfully higher than the 0.34-0.42 we saw for sources. Telecommunications was steadiest at 0.589, Consumer Electronics close behind at 0.557, and Sporting Goods lowest at 0.453. So roughly half of the brands mentioned today reappear tomorrow, versus only a third of sources. Brand presence is the more durable signal, which is why it makes a better core KPI than tracking individual URLs.
Two details are worth unpacking. First, Real Estate Sales was excluded entirely from the brand analysis. The engines only named a specific brand in 53.6% of Real Estate responses (below the 70% cutoff the researchers set for a vertical to have enough brand mentions to analyze reliably) because many of its prompts were generic tax and investment questions that LLMs answer without citing any company at all. Including it would have polluted the numbers, so it was dropped.
Second, Sporting Goods sat lowest for a concrete reason: there is a large, interchangeable pool of running-shoe brands, so the model has dozens of near-equivalent options to draw from and rotates through them across days.
And even here, ordering is unstable. RBO for brands ran just 0.19 to 0.30, so the rank in which brands appear still shifts a lot. Steadier than sources, but not something you can measure once and trust. This is the case for continuous AI brand monitoring alerts rather than one-off checks.
Finding #3: A Few Domains Capture Almost All the Citations
Not every cited domain gets an equal slice of the pie. In AI search, a small set of domains soaks up the vast majority of AI citations for any given topic, while everyone else fights over scraps.
The paper measures this with the Gini coefficient, a standard inequality score. It runs from 0 to 1: a Gini of 0 would mean every domain gets cited equally, and a Gini of 1 would mean a single domain grabs every citation. It’s the same math economists use to describe income inequality, applied here to citation counts.
Across all engines and campaigns, the mean Gini was 0.715. That is high. It means the citation landscape is heavily lopsided, with a handful of domains owning most of the visibility on each topic.
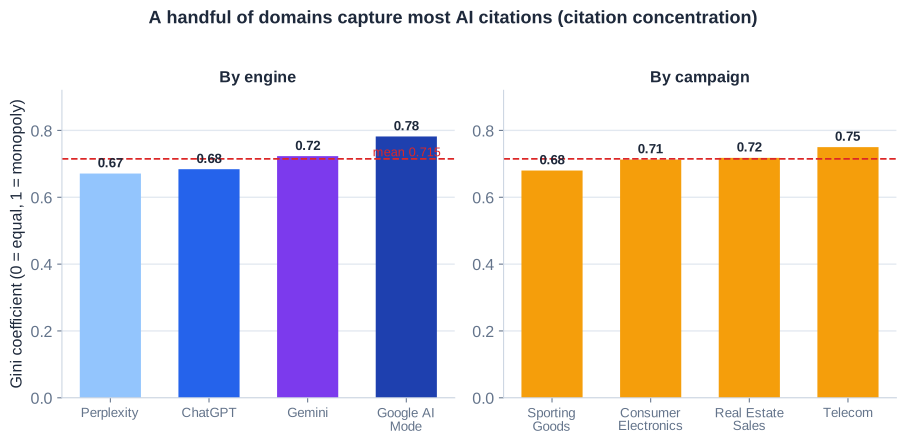
The concentration varies by engine. Perplexity spread its citations most evenly (Gini 0.671), followed by ChatGPT (0.684) and Gemini (0.723). Google AI Mode was the most concentrated of all at 0.782, meaning it leans hardest on a narrow pool of trusted sources.
It varies by topic too. Sporting Goods was the least concentrated (0.680), then Consumer Electronics (0.713) and Real Estate (0.718), with Telecommunications the most concentrated at 0.750.
The strategic takeaway: for any topic, a few domains own AI visibility, and everyone else is nearly invisible. Getting into that top tier is where the real payoff lives, so your AI share of voice strategy should focus on cracking the concentrated core rather than chasing a long tail that AI rarely surfaces.
Finding #4: It’s the Model, Not the News Cycle
If sources churn from day to day, maybe that’s just the world changing, right? New articles get published, domain authority shifts, indexes refresh. To test that, the researchers ran a clever experiment.
They fired the same prompt up to 10 times on the same calendar day, to all four engines. Same query, same conditions, minutes apart. If the day-to-day churn came from external news and index updates, then re-running a prompt within the same day should return nearly identical sources. Under old-school search assumptions, you’d expect near-perfect overlap.
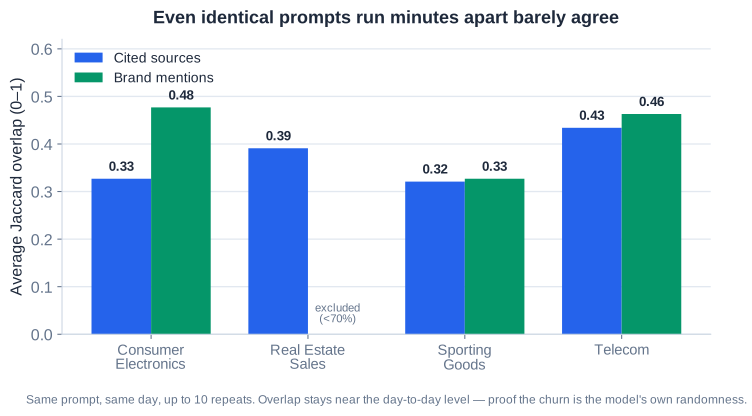
That is not what happened. Same-day source overlap (Jaccard) landed between 0.32 and 0.43 across campaigns, meaning only about a third of cited sources matched between two runs fired the same day. Consumer Electronics hit 0.327, Sporting Goods 0.321, Real Estate 0.391, and Telecom 0.434.
Here’s the punchline: that range is essentially identical to the day-to-day range of 0.34-0.42. Removing the news cycle as a factor changed almost nothing.
The conclusion is inescapable. The churn isn’t coming from external updates, algorithm changes, or a moving news cycle. It comes from the model’s own randomness: the probabilistic way an AI generates and selects sources for each answer. Query the same engine twice in a row and you’ll get meaningfully different sources, not because the world moved, but because the model rolled the dice again. That’s exactly why one measurement isn’t enough, and why monitoring has to average across repeated runs to mean anything.
Finding #5: The Four Engines Are Not Interchangeable
It’s tempting to treat “AI search” as one monolithic thing. The data says otherwise. The four engines behave so differently that assuming one reflects another will lead you badly astray.
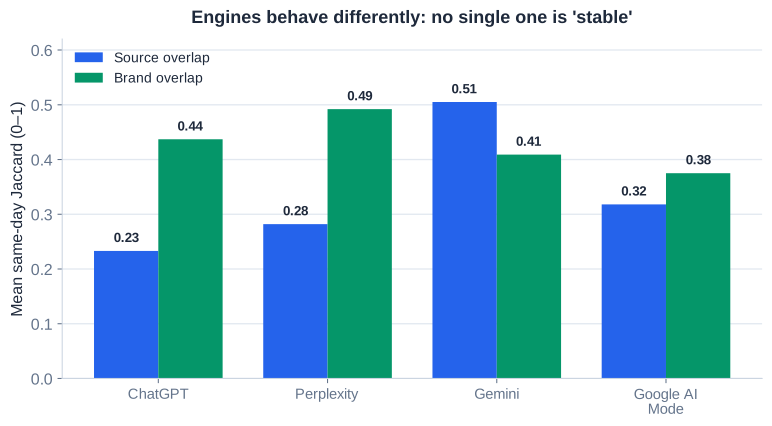
Breaking the same-day re-run results down by engine reveals a wide gulf in consistency. On sources, Gemini was by far the most consistent, with a same-day Jaccard of 0.505, meaning roughly half its cited sources held steady across repeated runs. ChatGPT was the least consistent at just 0.233, barely a quarter overlap. Perplexity (0.282) and Google AI Mode (0.318) sat in between.
The brand picture reshuffles the ranking entirely. On brand mentions, Perplexity led (Jaccard 0.492), followed closely by ChatGPT (0.437), then Gemini (0.409) and Google AI Mode (0.375). So the engine that’s steadiest on sources is not the steadiest on brands. There is no single “most stable” engine.
ChatGPT stands out for another reason. It returns zero citations on 57.8% of its runs. More than half the time it skips web search on definitional questions and answers from memory instead. Ask it “what’s the difference between a notebook and a laptop?” and it often won’t cite anyone at all. That’s a completely different behavior from Gemini or Perplexity, which reach for the web far more readily.
The lesson is simple but critical: you cannot assume one engine’s behavior reflects another. Each has its own randomness, its own citation habits, and its own quirks. Any serious monitoring program, or AI Visibility Index, has to set engine-specific baselines rather than blending everything into one number and hoping it generalizes.
Finding #6: The Prompt You Pick Swings the Result
Here is a wrinkle that catches most people off guard: the prompt you choose matters as much as how many times you run it. The study measured per-prompt consistency across every campaign, and the spread is enormous. Some prompts return nearly the same sources and brands run after run, with a Jaccard above 0.8, meaning better than 80% of items repeat. Others are almost pure noise, sitting below 0.2, where fewer than one in five items holds steady.
The pattern behind the spread is intuitive once you see it. Specific product queries get answered more consistently than broad, generic ones. A pointed question like “which running shoes are best” pulls a tighter, more repeatable set of brands and sources. A vague, top-of-funnel question, the kind that could be answered a dozen defensible ways, sends the model across a much wider pool each time.
The practical upshot: one or two prompts cannot represent a campaign. If you happen to pick two consistent prompts, you will overstate your stability. If you pick two erratic ones, you will convince yourself the whole category is chaos. Either way you are measuring the quirks of your prompt selection, not your actual visibility.
The fix is a large, diverse prompt portfolio that mirrors how real users ask: specific and broad, transactional and informational. Averaging across many prompts is the only way to cancel out this query-level noise and see the campaign as it really is.
How Many Times Should You Run Each Prompt?
Think of a single query as one coin flip. You would never decide whether a coin is fair from one toss, yet a one-off AI search query asks you to do exactly that. Because AI search engines are probabilistic, each run is a fresh roll of the dice, and the only way to learn how often your brand really shows up is to run the prompt many times and average the results. The more runs you stack up, the smaller your standard error (SE), the margin of uncertainty around your estimate.
The paper quantifies exactly how fast that margin shrinks.
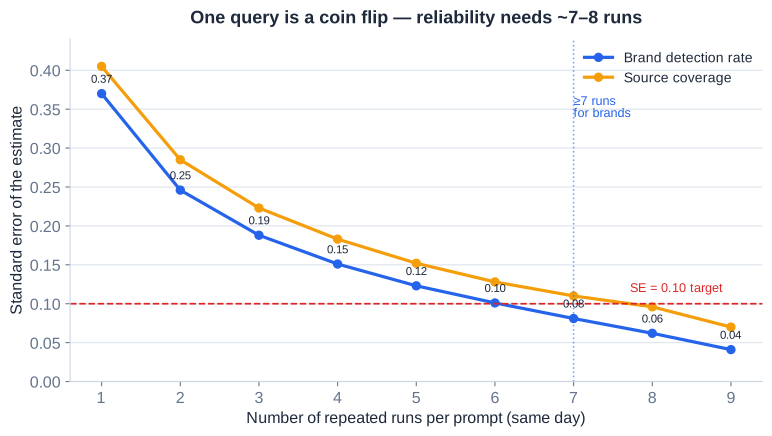
The convergence is steep early and then flattens. A single run carries an SE of 0.370, essentially useless. To put that in plain terms: a brand whose true detection rate is 50% could read anywhere from roughly 0% to 100% in a single-run snapshot. You would learn nothing.
Add runs and the fog clears fast:
| Runs per prompt | Standard error | 95% margin (±) |
|---|---|---|
| 1 | 0.370 | 0.724 |
| 3 | 0.188 | 0.369 |
| 5 | 0.123 | 0.241 |
| 6 | 0.101 | 0.197 |
| 7 | 0.081 | 0.158 |
| 8 | 0.062 | 0.121 |
SE drops below the 0.10 reliability line at 7 runs for brand tracking (it’s still 0.101 at six runs). Source-level coverage is noisier and needs 8 runs to get there.
So the recommendation is concrete: run at least 7 times per prompt per day when you are monitoring brand visibility, and at least 8 when source-level coverage matters. Fewer than that, and you are still flipping a single coin and calling it a measurement. This is the difference between a real AI Visibility Index and a lucky guess.
How Long Should You Watch? The Case for a 2 to 4 Week Window
Running each prompt enough times fixes the noise within a day. But there is a second source of drift: AI answers change from day to day too, and with roughly 65% of cited sources turning over every 24 hours, a single day (or even a single week) is far too short to separate signal from noise. You need a window wide enough to let the daily churn average out.
The study measured how estimate precision improves as the observation window lengthens.
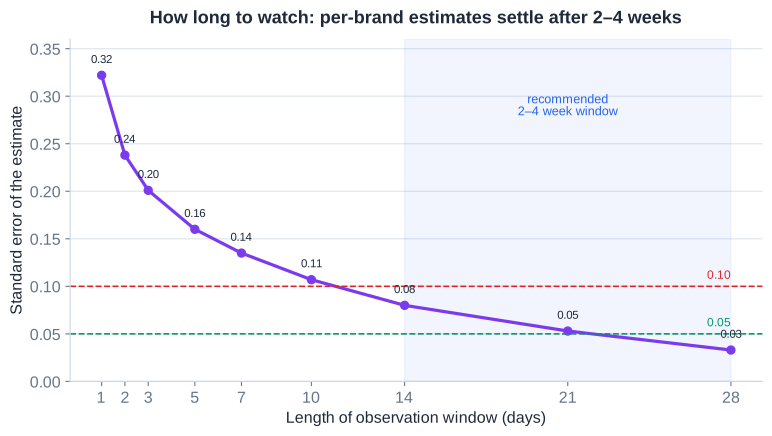
The same convergence logic applies, just over calendar time instead of repeated runs:
| Window (days) | Standard error | 95% margin (±) |
|---|---|---|
| 1 | 0.322 | 0.631 |
| 7 | 0.135 | 0.264 |
| 10 | 0.107 | 0.210 |
| 14 | 0.080 | 0.157 |
| 21 | 0.053 | 0.105 |
| 28 | 0.033 | 0.065 |
The estimate crosses below 0.10 at 10 days and dips under 0.05 right around the 24-day mark (it’s 0.053 at 21 days and 0.033 by 28). In practical terms: a week of data is still shaky for tracking any individual brand, but a 0.05 margin means a brand truly cited 40% of the time will read within roughly 30% to 50%, tight enough to trust a trend. Two to four weeks is where per-brand numbers become genuinely stable.
The recommendation is a rolling 2 to 4 week window. A rolling window does double duty: it gathers enough days to shrink the statistical margin, and it quietly averages out the minor model updates and index refreshes that AI engines push regularly, so a one-off tweak on a Tuesday doesn’t masquerade as a real trend. That is the window length you want baked into any monitoring dashboard or A/B testing AI visibility methodology before you draw conclusions about whether your visibility actually moved.
What This Means for Your GEO Strategy
The study translates directly into a handful of concrete rules for anyone running a GEO program. Treat these as the operating requirements for a measurement setup you can actually trust.
Fire every prompt at least 7 times a day (8 when sources matter). A single query has a standard error of 0.370 on a brand’s detection rate, essentially a coin flip dressed up as data. The error drops below 0.10 at 7 runs for brand presence and needs 8 runs for source-level coverage. Below that threshold, you are reacting to noise, not measuring visibility.
Cover each topic with a broad, diverse prompt portfolio. Prompt-level overlap swings from below 0.2 to above 0.8 within a single campaign, so one or two prompts capture the quirks of those exact phrasings rather than your real standing. Build at least eight varied queries per topic, a mix of specific product questions and broad “which is best” phrasings, so your numbers reflect the campaign, not an accident of wording.
Aggregate over a rolling 2 to 4 week window, not a day or a week. With roughly 65% of cited sources turning over daily, short windows can’t separate signal from noise. Per-brand estimates only settle below 0.10 SE at 10 days and below 0.05 at 24 days. A rolling two-to-four-week window smooths day-to-day churn and minor model updates into a durable read.
Set separate baselines for each engine. Citation concentration runs 0.671 on Perplexity up to 0.782 on Google AI Mode, and same-day source consistency ranges from 0.233 on ChatGPT to 0.505 on Gemini. A single threshold across all four engines will mislead you on at least one. Benchmark each engine on its own terms.
Monitor brand presence and source URLs as two different KPIs. Brand-level stability (Jaccard 0.45-0.59) beats source-level stability (0.34-0.42), so aggregated brand presence is your more reliable headline metric. But keep tracking sources at the URL level too, since that is what tells you which pages are actually driving your inclusion.
Honest Limitations Worth Knowing
The authors are refreshingly upfront about what this dataset can and can’t tell you, and every caveat is a reason to run your own continuous measurement rather than lean on one study.
It’s Swiss. All data came from servers in Switzerland, with Swiss IPs and locale, across German-language prompts. Geo-personalized index selection and citation patterns may look different in your region or language, so treat the exact numbers as directional, not universal.
It’s one time window. Everything runs from a single 45 to 46 day period (Jan to Mar 2026). AI engines update constantly, so a snapshot from any fixed window, including this one, can drift.
ChatGPT often returned nothing. ChatGPT skipped web search on 57.8% of runs, producing zero citations; those runs were excluded from the source analysis. Your own ChatGPT coverage will be patchier than the headline figures suggest.
Brand detection was substring-based. Mentions were matched against a fixed lexicon, so synonyms, abbreviations, and paraphrases were missed. Real brand presence is likely somewhat higher than measured.
Google AI Overviews were excluded as a different product. If AIO matters to you, that’s an entire surface this study never touched.
None of this undermines the core finding; it reinforces it. The only way to know how visibility behaves in your market, your language, and this month is to measure it yourself, continuously.
How to Put Repeated Measurement Into Practice
Here is the practical checklist that follows from the study, the minimum viable setup for GEO measurement you can act on:
- Run each prompt 7 to 10 times per day. Seven runs gets brand detection under the reliability line; eight covers sources; ten gives you headroom.
- Maintain a diverse portfolio of 8+ prompts per topic. Mix specific product queries with broad “which is best” phrasings.
- Track per-engine baselines. ChatGPT, Gemini, Google AI Mode, and Perplexity behave differently on both consistency and citation concentration, so benchmark each separately.
- Use a rolling 2 to 4 week window. Aggregate detection rates over 14 to 28 days so daily source churn and minor model updates wash out.
- Monitor brand presence and source URLs separately. Brand-level presence is your stable headline KPI; source tracking tells you which pages earn the inclusion.
- Watch citation concentration. A rising Gini means a shrinking set of domains owns the answers, so know whether you’re inside that set or outside it.
Doing all of this by hand across four engines, dozens of prompts, and daily re-runs is a lot of moving parts. An AI-visibility monitoring platform like amicited automates exactly this pattern (multi-run, multi-prompt, rolling-window tracking across ChatGPT, Gemini, Google AI Mode, and Perplexity) so the distribution is computed for you instead of eyeballed from a single query. For a broader survey of options, see the AI citation tracking tools guide, and to catch shifts as they happen, set up AI brand monitoring alerts.
The Bottom Line: Visibility Is a Distribution, Not a Number
The single most important takeaway from this study is a mental model shift. AI-search visibility is not a fixed ranking you can read off with one query. It is a probability of being mentioned that only reveals itself across many runs. Remember the running-shoe question we opened with? Ask it once and you might see your brand; ask again a minute later, under identical conditions, and it may be gone. Source sets overlap just 34-42% day to day; even brands, the more stable signal, only overlap 45-59%.
That means every number you pull from a single check is really a random draw from an underlying distribution, and drawing once tells you almost nothing about the shape of that distribution. A brand cited in one run and absent in the next hasn’t “dropped”; you simply sampled a random, dice-rolling process one time and mistook that one sample for the truth.
So stop asking “am I cited?” and start asking “how often am I cited, and how is that trending?” Repeated runs, diverse prompts, per-engine baselines, and rolling windows turn a noisy snapshot into a stable, decision-grade estimate. Measure the distribution, not the moment. That is the whole game in AI search.
Track your prompts across every AI engine
Stop trusting a single query. AmICited runs your prompts over and over across ChatGPT, Perplexity, Gemini and Google AI Overviews, then turns the noise into a stable, daily view of how AI describes your brand and where to grow next.
Free check · 7-day trial · card required
 LinkedIn