


Understanding Your Current AI Visibility: A Self-Assessment Guide
Learn how to conduct a baseline AI visibility audit to understand how ChatGPT, Google AI, and Perplexity mention your brand. Step-by-step assessment guide for b...
11 min read
A practical framework for sizing your AI visibility budget, deciding what to fund, and building the internal business case — from percentage-of-marketing-budget benchmarks to quarterly ROI reviews.
AI visibility refers to a brand’s presence and prominence in AI-generated answers across platforms like ChatGPT, Perplexity, Google AI Overviews, and other large language models. Unlike traditional search engine visibility, which focuses on ranking in organic results, AI visibility encompasses how often and how favorably your brand appears when users ask AI systems questions related to your industry, products, or services. This distinction is critical because AI systems source information differently than traditional search engines—they aggregate data from multiple sources, prioritize authoritative content, and present synthesized answers rather than ranked links. According to Yext research analyzing 6.8 million AI citations across ChatGPT, Gemini, and Perplexity, 86% of AI citations come from brand-managed content, highlighting the importance of strategic visibility management. The business impact is substantial: as of 2024, 78% of organizations are using AI, up from 55% the previous year, according to Stanford’s AI Index. This explosive adoption means that AI-generated answers are increasingly becoming the first touchpoint for customer discovery. When your brand appears in an AI response, you gain credibility through third-party validation, drive qualified traffic, and establish authority in your market. The connection between AI visibility and ROI is direct—brands that appear in AI answers experience higher click-through rates, improved brand recall, and increased customer acquisition. McKinsey research shows that organizations leveraging AI strategically expect 60% higher AI-driven revenue growth by 2027 compared to competitors. For marketing managers and CFOs, this means that investing in AI visibility is no longer optional; it’s a fundamental component of modern brand strategy. The challenge, however, is that most organizations lack dedicated budgets and strategies for AI visibility, creating a significant competitive advantage for early movers who allocate resources strategically.
This guide focuses on the planning side of that challenge: how big your AI visibility budget should be, which categories deserve funding, and how to build the internal case for it. Once you’ve settled on a top-line number, the follow-up question — which specific team roles, tools, and AI platforms should absorb that spend — is answered in our companion tactical guide, budget allocation for AI visibility: team, tools, and platform spend .
The risks of neglecting AI visibility monitoring are substantial and multifaceted:
Missed Citation Opportunities: Without active monitoring, you won’t know when your brand could appear in AI answers, meaning you lose opportunities to capture high-intent users who are already asking AI systems about your industry or solutions.
Competitor Dominance in AI Responses: While you ignore AI visibility, competitors are optimizing their content and strategies to appear in AI-generated answers, capturing market share and customer mindshare that should belong to your brand.
Loss of Brand Authority and Trust: When AI systems cite competitors instead of your brand, it signals to users that your competitors are more authoritative, trustworthy, and relevant—a perception that’s difficult to reverse once established.
Reduced Customer Acquisition Efficiency: AI-generated answers are becoming a primary discovery channel, especially for younger audiences. Absence from these answers means losing qualified leads at the moment of highest intent, forcing you to rely on more expensive paid channels.
Erosion of Brand Equity: Brands that don’t appear in AI responses gradually lose visibility in the minds of consumers who increasingly rely on AI for recommendations and information, particularly in B2B and professional services sectors.
Real-World Impact Examples: E-commerce brands that ignored AI visibility saw competitors capture 40-60% more qualified traffic through AI platforms. Professional services firms that didn’t optimize for AI visibility lost client inquiries to competitors who appeared in AI-generated recommendations. Travel and hospitality brands that failed to monitor AI citations missed opportunities to appear in AI-powered travel planning assistants.
Reactive vs. Proactive Costs: The cost of recovering lost AI visibility is significantly higher than the cost of maintaining it proactively. Brands that ignored AI visibility initially face 3-6 month recovery periods and must invest heavily in content optimization and competitive repositioning.
This is the risk a budget is meant to insure against — which is why the next question isn’t just “what should we fund,” but “how much is enough to close that gap.”

Track how AI chatbots mention your brand across ChatGPT, Perplexity, and other platforms.
Before you decide what to fund, decide how much you’re funding. Most organizations approach sizing in one of two ways: as a percentage of the overall marketing budget, or as a fixed monthly investment tied to a specific starting scope.
The percentage-of-marketing-budget approach is the more common starting point. Industry best practice is to allocate 5-10% of your total marketing budget to AI visibility initially, growing to 15-25% within 2-3 years as AI becomes more central to customer discovery. Where you land in that range depends on your industry, competitive intensity, and how large your current visibility gap already is — organizations in highly competitive markets or those targeting AI-native audiences should sit at the higher end from day one.
The fixed-scope approach works better if you don’t yet have a marketing budget line to draw a percentage from, or if you want to test the waters before committing. You can start with a modest $2,000-5,000 monthly budget focused purely on monitoring and competitive analysis — enough to establish your baseline visibility and identify where the biggest gaps are — before expanding into content optimization and team resources once you have data to justify it.
Your organization’s maturity should also shape the shape of the budget, not just its size. Early-stage organizations typically get more value from weighting monitoring and content optimization heavily (60-70% of budget combined) to establish baseline visibility fast, while organizations with an established AI presence usually shift more toward advanced analytics and competitive intelligence (40-50% combined) to defend and extend their position. Neither allocation is “correct” in isolation — the right mix is the one that matches where you currently stand.
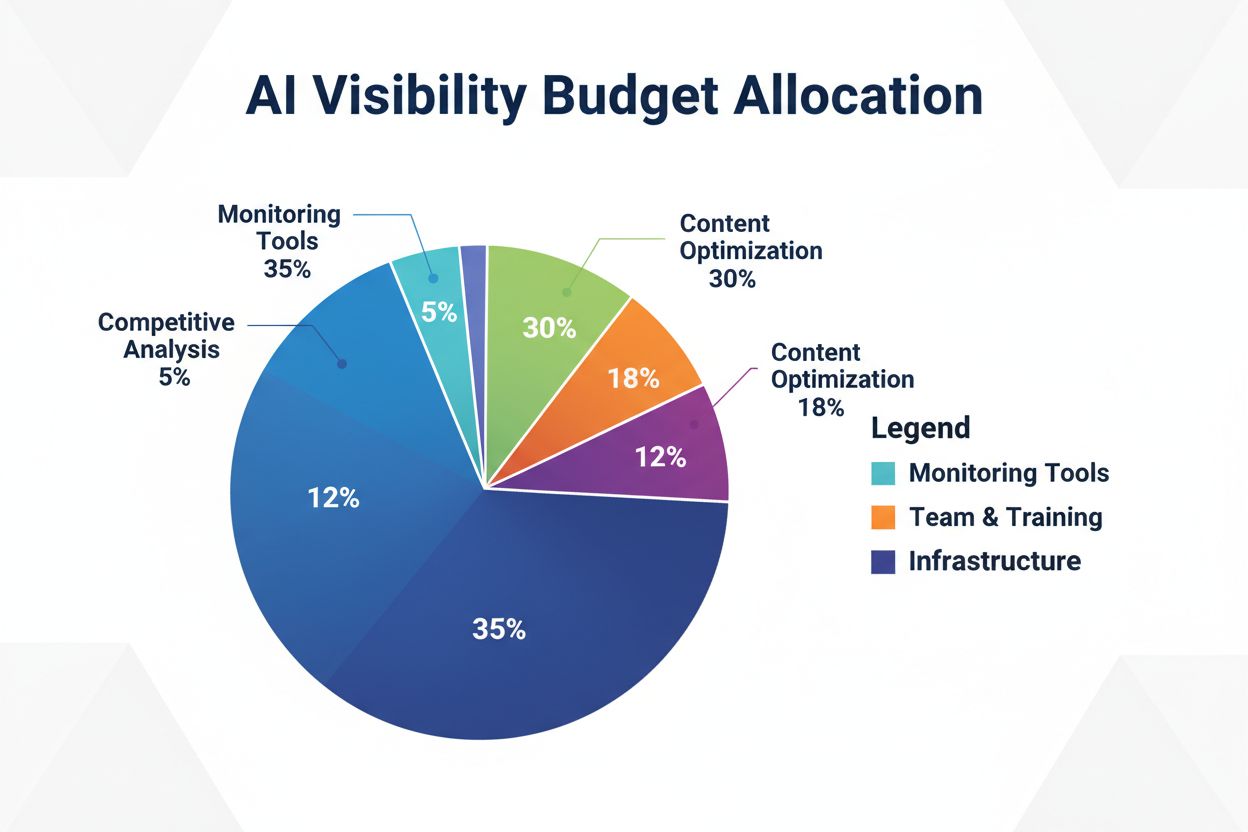
Once you know the size of the budget, the next decision is how to break it down. Effective AI visibility budgeting requires a strategic split across multiple categories, each serving a distinct purpose. Rather than treating AI visibility as a single line item, forward-thinking organizations allocate resources across five primary categories that work together to maximize presence and impact in AI-generated answers.
| Budget Category | Percentage | Purpose | Tools/Examples |
|---|---|---|---|
| Monitoring & Analytics Platforms | 25-30% | Real-time tracking of brand mentions, citation quality, and competitive positioning across AI systems | AmICited.com, Amplitude, Semrush AI Visibility, Moz AI Tracking |
| Content Optimization & Creation | 35-40% | Developing and refining content specifically structured for AI indexing and citation, including technical optimization | Content management systems, AI-optimized writing tools, SEO platforms |
| Team Resources & Training | 15-20% | Salaries, training, and development for dedicated AI visibility specialists and cross-functional team members | Internal team costs, certification programs, industry conferences |
| Technology Infrastructure | 10-15% | Data collection systems, API integrations, storage, and real-time monitoring capabilities | Cloud infrastructure, API services, data warehousing solutions |
| Competitive Analysis & Intelligence | 10-15% | Understanding competitor strategies, benchmarking performance, and identifying market gaps | Competitive intelligence tools, market research platforms, custom analysis |
These categories are interdependent — investing in monitoring without content optimization yields insights but no improvement, while investing in content without measurement prevents you from understanding ROI. Here’s what each category is actually buying you.
The monitoring platform you choose determines what metrics you can track, how quickly you can respond to visibility changes, and how effectively you can measure ROI across every other category. AmICited.com provides real-time tracking of brand mentions, citation frequency, citation quality scoring, and competitive positioning against visibility competitors — metrics that broader tools like Amplitude (product analytics) or Zapier’s basic AI visibility integrations either miss or deliver with significant delay. The ROI math is straightforward: a platform costing $500-2,000 monthly can identify citation opportunities worth $50,000-500,000 in incremental revenue annually, depending on your industry and customer lifetime value. This category is the intelligence backbone that justifies and directs spending in every other row of the table.
AI systems don’t rank content the way traditional search engines do — they synthesize and extract information from multiple sources to generate answers, which is why content built purely for keyword rankings often underperforms in AI citations. This is the largest line item (35-40%) because it funds the actual work of restructuring content, implementing structured data, and creating answer-focused resource pages that AI systems can parse and cite. Brands that restructure content for AI visibility typically see 40-60% increases in citation frequency within 3-6 months.
AI visibility management requires skills that span data analysis, content strategy, and technical implementation — skills that are still relatively rare in the market, which is exactly why this category is easy to underfund and expensive to underfund badly. Rather than duplicate that breakdown here, see the team structure and in-house-vs-agency section of our tactical resource-allocation guide for the specific roles, skill sets, and staffing tradeoffs this line item covers.
This category funds the systems that collect, process, and analyze visibility data at scale: real-time data collection across AI platforms, historical storage for trend analysis, API integrations connecting your monitoring platform to your internal tools, and the security and compliance controls (encryption, access controls, audit logging, GDPR/CCPA compliance) that regulated industries in particular need. Budget roughly $2,000-5,000 monthly in cloud infrastructure for a mid-market organization. Organizations that skimp here often find themselves unable to trust the data they’re collecting, which undermines ROI across every other category.
This is the category most often undervalued relative to its strategic payoff. Tracking competitor visibility reveals which competitors are winning in AI-generated responses and what content strategies they’re using, while benchmarking against industry norms gives your own visibility numbers context — knowing you appear in 15% of relevant AI answers only means something once you know the industry average is 8% or your top competitor sits at 25%. Organizations that systematically track competitor AI visibility typically identify 3-5 major optimization opportunities every quarter, insights that should directly inform where your content optimization budget goes next.
Get the latest insights on AI mentions, brand monitoring, and optimization strategies.
Getting budget approved — and keeping it — depends on your ability to show the numbers behind it. The foundation is establishing clear baseline metrics before you begin optimization efforts, then tracking changes over time and attributing them to specific investments.
| Metric | Importance | How to Measure | Target |
|---|---|---|---|
| Brand Mention Frequency | Critical | Track mentions across ChatGPT, Perplexity, Google AI Overviews monthly | 40-60% increase YoY |
| Citation Quality Score | High | Analyze prominence, context, and sentiment of citations using AmICited.com | 70%+ positive/prominent citations |
| Query Coverage | High | Measure percentage of relevant industry queries where brand appears | 50%+ of target queries |
| Traffic Attribution | Critical | Track conversions from AI-sourced traffic using UTM parameters and analytics | 15-25% of total organic traffic |
| Brand Sentiment | Medium | Analyze language and context of citations for positive/negative indicators | 80%+ neutral or positive |
| Cost Per Citation | High | Divide total AI visibility budget by number of new citations generated | $50-200 per citation |
| Customer Acquisition Cost (AI channel) | Critical | Calculate CAC specifically for customers acquired through AI visibility | 30-50% lower than paid channels |
When you present this to leadership, lead with cost per citation and CAC comparison against paid channels — those are the two numbers a CFO will actually anchor a budget decision on. Measure AI visibility’s impact on sales specifically by tracking traffic attribution from AI sources with UTM parameters, monitoring conversion rates from that traffic, and calculating CAC for the AI channel using a tool like Google Analytics 4 to segment by source.
Quarterly reviews are the industry standard cadence for reassessing allocation: analyze performance against targets, identify underperforming categories, reallocate to what’s working, and adjust for competitive or platform changes. Organizations that measure ROI rigorously and adjust quarterly achieve 2-3x better results than those that set a budget annually and leave it alone. One B2B SaaS company, for example, initially allocated 40% of budget to content optimization but found through measurement that monitoring and competitive analysis were driving higher ROI — it reallocated to 30% content, 35% monitoring, and 20% competitive analysis, and saw a 45% improvement in citation quality within six months. That kind of mid-course correction is only possible if the business case includes a measurement plan from the start, not just a spending plan.
Geographic variations in AI adoption and usage patterns require tailored budget allocation strategies that account for regional differences in AI platform popularity, user behavior, and competitive intensity. AI adoption is not uniform globally—North America leads in AI adoption with 78% of organizations using AI, while Europe shows 65% adoption and Asia-Pacific shows 58% adoption according to 2024 data. Within regions, adoption varies significantly by country, with the United States, United Kingdom, Canada, and Australia showing highest adoption, while emerging markets show lower but rapidly growing adoption. These variations mean that your AI visibility budget allocation should reflect where your customers are and where AI is most influential in their decision-making. For organizations with North American focus, allocating 50-60% of budget to ChatGPT and Google AI Overviews makes sense, while European organizations should allocate more heavily to Perplexity (which has stronger adoption in Europe) and Google AI Overviews. Industry-specific AI visibility needs vary dramatically—B2B SaaS companies benefit most from appearing in AI answers to technical and business questions, while e-commerce brands benefit from appearing in AI shopping recommendations, and professional services firms benefit from appearing in AI-generated advice and recommendations. These vertical differences should inform both your content optimization priorities and your monitoring platform selection. Regional budget allocation strategies should account for local competition intensity, local AI platform preferences, and local customer behavior. For example, a global e-commerce brand might allocate 40% of budget to North American AI visibility (where adoption is highest and competition is intense), 35% to European markets (growing adoption, moderate competition), and 25% to Asia-Pacific (emerging opportunity, lower current competition). Global vs. local AI visibility strategies require balancing centralized strategy with local execution—your core brand positioning and content should be consistent globally, but local teams should optimize for regional AI platform preferences and competitive dynamics. Organizations managing multiple geographies should use AmICited.com’s geographic tracking capabilities to monitor visibility by region and adjust budget allocation based on regional performance and opportunity.
Organizations new to AI visibility budgeting frequently make predictable planning mistakes that undermine ROI before a dollar is even spent. The most common is over-investing in tools without strategy—purchasing monitoring platforms, competitive intelligence tools, and content optimization software before establishing clear goals. This results in paying for capabilities you don’t use and missing insights because you lack the team expertise to interpret the data. Start with strategy and goals, then select tools that support those specific objectives. Underfunding content and team resources relative to monitoring is another frequent error — organizations invest heavily in visibility into their problems but leave too little budget to actually fix them; content optimization should represent 35-40% of your budget and team resources 15-20%, not afterthoughts. Ignoring geographic and vertical nuance by applying a single flat allocation across every region and product line wastes budget on markets and platforms where your customers simply aren’t looking. Reactive vs. proactive budgeting is a critical distinction—organizations that budget reactively, responding to visibility drops or competitive threats after the fact, spend 2-3x more than organizations that budget proactively and maintain visibility continuously. Establish baseline budgets for ongoing monitoring and optimization, then reserve additional budget for reactive improvements only when genuinely necessary. Failing to build a measurement plan into the business case is perhaps the most damaging mistake, because it prevents you from learning what works and defending the budget at the next review. Organizations that don’t measure ROI typically waste 30-40% of their budget on initiatives nobody can prove are working.
The AI landscape is evolving rapidly, with new platforms, capabilities, and competitive dynamics emerging constantly. Future-proofing your AI visibility budget requires building flexibility into your allocation strategy and planning for evolution rather than assuming current conditions will persist. Emerging AI platforms are launching regularly—while ChatGPT, Perplexity, and Google AI Overviews currently dominate, new platforms like Claude’s web interface, Microsoft’s Copilot, and specialized AI assistants for specific industries are gaining traction. Your budget allocation should include 10-15% flexibility to test and optimize for emerging platforms before they become dominant. The evolution of AI answer generation is accelerating—AI systems are becoming more sophisticated in how they source, synthesize, and present information, and these changes directly impact visibility strategies. What works for current AI systems may be less effective as systems evolve to prioritize different types of sources or content formats. Preparing for new monitoring capabilities means staying informed about advances in AI visibility tracking and being willing to adopt new tools and approaches as they emerge — your monitoring platform should support emerging AI systems and new tracking capabilities, which is why selecting platforms with strong R&D investment and regular feature updates matters. Flexibility in budget allocation is essential—rather than locking in fixed percentages across categories, establish ranges (e.g., 30-40% for content optimization rather than exactly 35%) that allow you to shift resources based on emerging opportunities and changing competitive dynamics. Long-term strategic planning should extend 18-24 months into the future, with quarterly reviews and adjustments layered on top. Plan for how AI visibility will evolve in your industry, what new competitors might emerge, and how customer behavior might change. Integration with overall marketing budget is critical—AI visibility shouldn’t be a siloed initiative but rather a core component of your overall marketing strategy, growing from the 5-10% starting allocation discussed earlier toward 15-25% of total marketing budget within 2-3 years. Organizations that build flexibility, maintain a learning orientation, and integrate AI visibility into overall strategy will be best positioned to capitalize on the AI-driven future of customer discovery and brand visibility.
Viktor Zeman is a co-owner of QualityUnit. Even after 20 years of leading the company, he remains primarily a software engineer, specializing in AI, programmatic SEO, and backend development. He has contributed to numerous projects, including LiveAgent, PostAffiliatePro, FlowHunt, UrlsLab, and many others.

Start tracking your brand's presence across ChatGPT, Perplexity, and Google AI Overviews with AmICited to establish the baseline data your budget case needs.
Learn how to conduct a baseline AI visibility audit to understand how ChatGPT, Google AI, and Perplexity mention your brand. Step-by-step assessment guide for b...

Learn how to connect AI visibility metrics to measurable business outcomes. Track brand mentions in ChatGPT, Perplexity, and Google AI Overviews with actionable...

Understand the critical relationship between brand visibility and AI search visibility. Learn how AI systems discover, cite, and recommend brands in ChatGPT, Pe...
Cookie Consent
We use cookies to enhance your browsing experience and analyze our traffic. See our privacy policy.