



Revenue Per Customer
Revenue per customer measures the average amount of revenue a business generates from each customer over a given period, calculated by dividing total revenue by the number of unique customers. It's a useful summary metric for tracking whether a business is growing revenue by acquiring more customers, selling more to existing ones, or both.
Definition of Revenue Per Customer
Revenue per customer measures the average revenue a business generates from each unique customer over a given period, such as a month, quarter, or year. It’s calculated by dividing total revenue by the number of unique customers who purchased during that period. Unlike average order value, which looks at a single transaction, revenue per customer captures everything a customer spent across however many orders they placed within the period — making it a useful bridge metric between order-level and lifetime-level views of customer value.
How Revenue Per Customer Is Calculated
The formula is straightforward:
Revenue Per Customer = Total Revenue ÷ Number of Unique Customers
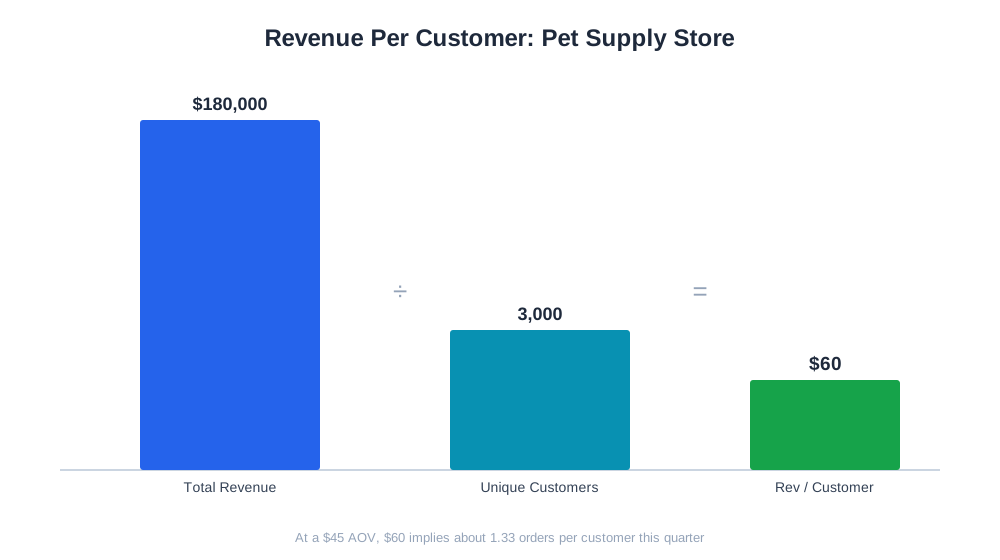
A worked example: an online pet supply store generates $180,000 in revenue in a quarter from 3,000 unique customers. Revenue per customer = $180,000 ÷ 3,000 = $60.
If that same store’s AOV is $45, the $60 revenue-per-customer figure implies the average customer placed roughly 1.33 orders in the quarter — a useful cross-check that reveals purchase frequency without needing a separate calculation.

Ready to Monitor Your AI Visibility?
Track how AI chatbots mention your brand across ChatGPT, Perplexity, and other platforms.
Why Revenue Per Customer Matters for E-commerce Brands
Revenue per customer helps distinguish between two very different ways a business can grow: adding new customers versus getting more value from existing ones. A business whose total revenue is climbing but whose revenue per customer is flat or declining is growing primarily through acquisition — which is fine, but worth knowing, since acquisition-driven growth is generally more expensive to sustain than growth driven by deeper relationships with existing customers.
Tracking revenue per customer over time also gives an early read on the health of retention and cross-sell efforts. A rising revenue-per-customer trend, especially alongside a stable or growing customer count, generally indicates that repeat purchase behavior and upsell strategies are working.
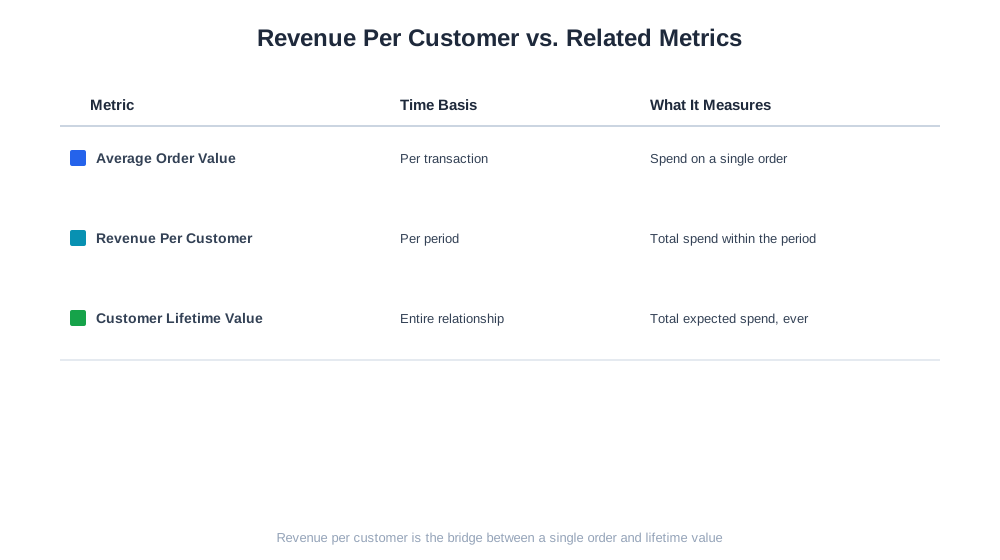
Revenue Per Customer vs. Related Metrics
| Metric | Time Basis | What It Measures |
|---|---|---|
| Average Order Value | Per transaction | Spend on a single order |
| Revenue Per Customer | Per period (month, quarter) | Total spend by a customer within that period |
| Customer Lifetime Value | Entire relationship | Total expected spend over the customer’s full lifespan |
Stay Updated on AI Visibility Trends
Get the latest insights on AI mentions, brand monitoring, and optimization strategies.
Revenue Per Customer and AI-Driven Commerce
As AI shopping assistants influence which products customers discover and re-purchase, revenue per customer becomes a useful metric for evaluating whether AI-driven traffic is bringing in customers who buy once and disappear, or customers who return and build a deeper spending relationship with the brand — a distinction that matters more than raw traffic or first-order conversion alone.
AmICited’s eshop_get_kpis and eshop_get_ltv tools report revenue per customer alongside lifetime value metrics for connected stores, giving merchants a way to see both the recent-period and long-term view of customer value side by side.
Best Practices and Common Mistakes
Track revenue per customer by cohort or segment rather than as a single blended figure, since new customer cohorts naturally start with a lower revenue-per-customer figure than a mature cohort of repeat buyers. Watch it alongside customer count and AOV so a decline can be correctly attributed to fewer repeat purchases, lower order values, or simply dilution from rapid new customer growth, rather than assuming a single cause. And avoid comparing revenue per customer across very different period lengths — a monthly figure and an annual figure aren’t directly comparable, and mixing them leads to misleading conclusions about whether customer value is actually rising or falling.