


Average Order Value (AOV)
Average Order Value (AOV) measures the average amount a customer spends each time they place an order, calculated by dividing total revenue by the number of orders over a given period. It's one of the most widely tracked e-commerce metrics because it directly affects profitability without requiring more traffic or new customers.
Definition of Average Order Value (AOV)
Average Order Value (AOV) is the average amount of money a customer spends per transaction on an e-commerce store. It’s calculated by dividing total revenue over a period by the total number of orders placed in that same period. AOV is one of the three core levers of e-commerce revenue — alongside traffic and conversion rate — and it’s often the most cost-effective one to improve, because increasing AOV doesn’t require acquiring a single new visitor. A merchant who raises AOV from $60 to $70 across the same order volume adds meaningful revenue without spending an additional dollar on advertising.
How AOV Is Calculated
The formula is simple:
AOV = Total Revenue ÷ Number of Orders
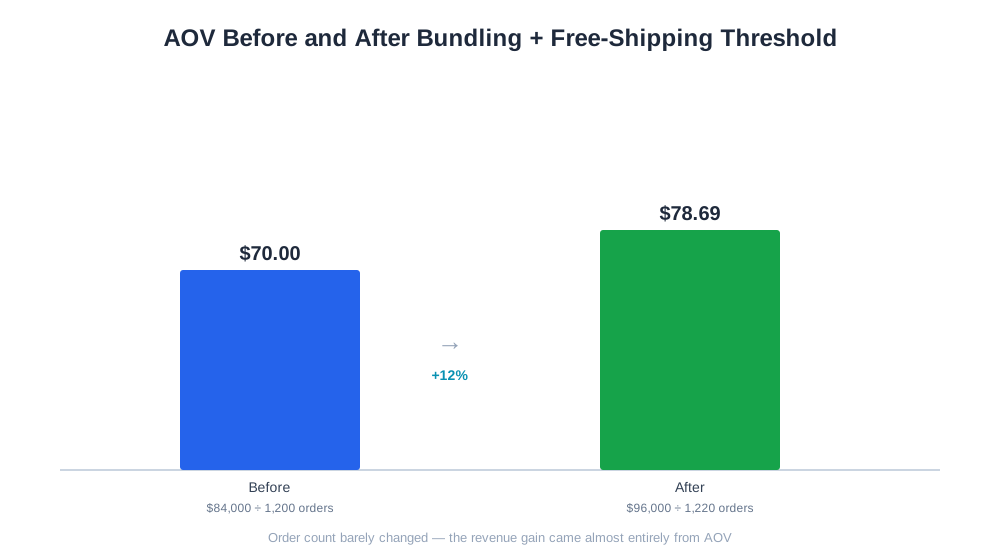
A worked example: a skincare brand generates $84,000 in revenue from 1,200 orders in a month. AOV = $84,000 ÷ 1,200 = $70.
Now suppose the brand introduces a free-shipping threshold at $75 and a “complete your routine” bundle recommendation at checkout. The following month, revenue rises to $96,000 from 1,220 orders — a similar order count, but AOV climbs to $96,000 ÷ 1,220 = $78.69, roughly a 12% increase. Since order count barely changed, nearly all of the additional revenue came directly from the AOV lift rather than from new customer acquisition.

Ready to Monitor Your AI Visibility?
Track how AI chatbots mention your brand across ChatGPT, Perplexity, and other platforms.
Why AOV Matters for E-commerce Brands
AOV directly affects two things merchants care about most: revenue and profitability per order. A higher AOV, achieved efficiently, means each customer acquisition effort — whether paid ad spend or organic traffic — generates more revenue per conversion, which improves the return on every marketing dollar spent. This is especially important for brands with high customer acquisition costs, where the margin on a single low-AOV order might not cover the cost of acquiring the customer at all, but a higher AOV order comfortably does.
AOV is also a useful early signal for merchandising and pricing decisions. A sudden AOV decline might indicate that customers are trading down to cheaper products, that a popular high-price item went out of stock, or that a promotional campaign is training customers to buy only discounted items. Tracking AOV alongside order volume and contribution margin gives a much fuller picture than watching revenue alone.
AOV Benchmarks and Tactics by Category
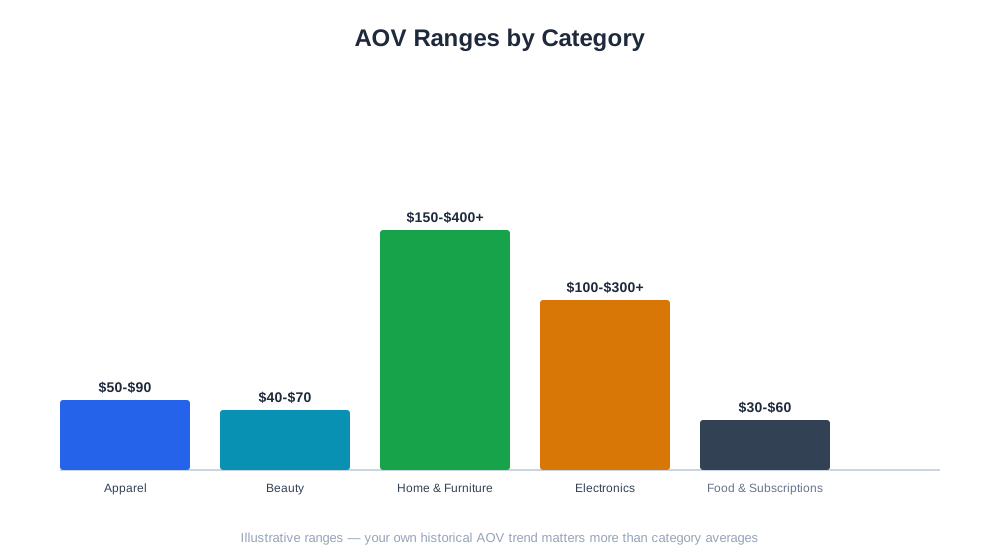
| Category | Typical AOV Range | Common AOV-Increasing Tactic |
|---|---|---|
| Apparel & accessories | $50-$90 | Bundle discounts, buy-more-save-more tiers |
| Beauty & personal care | $40-$70 | Free-shipping threshold, sample add-ons |
| Home goods & furniture | $150-$400+ | Financing options, room-based bundles |
| Electronics | $100-$300+ | Extended warranty upsells, accessory cross-sells |
| Food & subscription boxes | $30-$60 | Quantity discounts, subscribe-and-save pricing |
These are illustrative ranges, not fixed benchmarks — a store’s own historical AOV trend, compared against its own contribution margin, is the more reliable signal to act on.
Stay Updated on AI Visibility Trends
Get the latest insights on AI mentions, brand monitoring, and optimization strategies.
AOV and AI-Driven Commerce
As AI shopping assistants like ChatGPT Shopping, Perplexity Shopping, and Amazon’s Rufus increasingly generate multi-product shopping lists or bundled recommendations on a customer’s behalf, they have the potential to influence AOV in either direction — surfacing a complete outfit or a full skincare routine can push AOV up, while an assistant that finds the single cheapest matching item for a customer could push it down. Merchants who structure their product feeds with clear bundle and companion-product information give these assistants better material to recommend a fuller basket rather than a single item.
AmICited’s eshop_get_kpis tool reports AOV as part of its executive KPI deck for connected stores, alongside revenue, order count, and margin metrics, so merchants can track whether AOV-focused initiatives — a new bundle, a shipping threshold change, a checkout upsell — are actually moving the number, and whether that movement is translating into healthier overall profitability.
Best Practices for Increasing AOV
- Set free-shipping thresholds slightly above your current AOV, not far above it, so the incentive to add one more item feels achievable rather than out of reach.
- Use product affinity data to recommend genuinely complementary items at checkout rather than arbitrary upsells that feel disconnected from the purchase.
- Offer quantity-based discounts on consumable or replenishable products, which increase order size without requiring the customer to buy something unrelated.
- Test bundle pricing against individual item pricing to confirm bundles are actually increasing order value rather than just repackaging what customers would have bought anyway.
- Monitor AOV alongside contribution margin, not in isolation, to make sure AOV gains driven by discounting aren’t quietly eroding profit per order.
Common AOV Mistakes
Chasing AOV increases through discounting alone. Offering a discount that only applies above a certain cart value can increase AOV numerically while reducing the actual profit per order, since the higher revenue figure comes bundled with a lower margin. Any AOV-increasing tactic should be checked against contribution margin, not judged on revenue alone.
Setting the free-shipping threshold too far above current AOV. If AOV is $55 and the free-shipping threshold is set at $100, most customers won’t bridge that gap and will simply pay for shipping instead, missing the intended nudge entirely. A threshold 10-20% above current AOV is usually a more effective starting point.
Recommending irrelevant upsells. Generic “customers also bought” widgets that ignore product affinity data often get ignored or feel like noise, doing little to move AOV. Recommendations grounded in actual co-purchase patterns convert meaningfully better.
Measuring AOV without segmenting by channel or customer type. A blended AOV can mask the fact that new customers spend far less per order than repeat customers, or that one traffic channel consistently drives higher-value carts than another. Segmenting AOV reveals where the biggest opportunity for improvement actually sits.
Ignoring AOV trends after a catalog or pricing change. Adding a new lower-priced entry product or running a broad sitewide discount will naturally pull AOV down; treating that shift as a performance problem, rather than an expected consequence of a catalog decision, leads to chasing the wrong fix.