


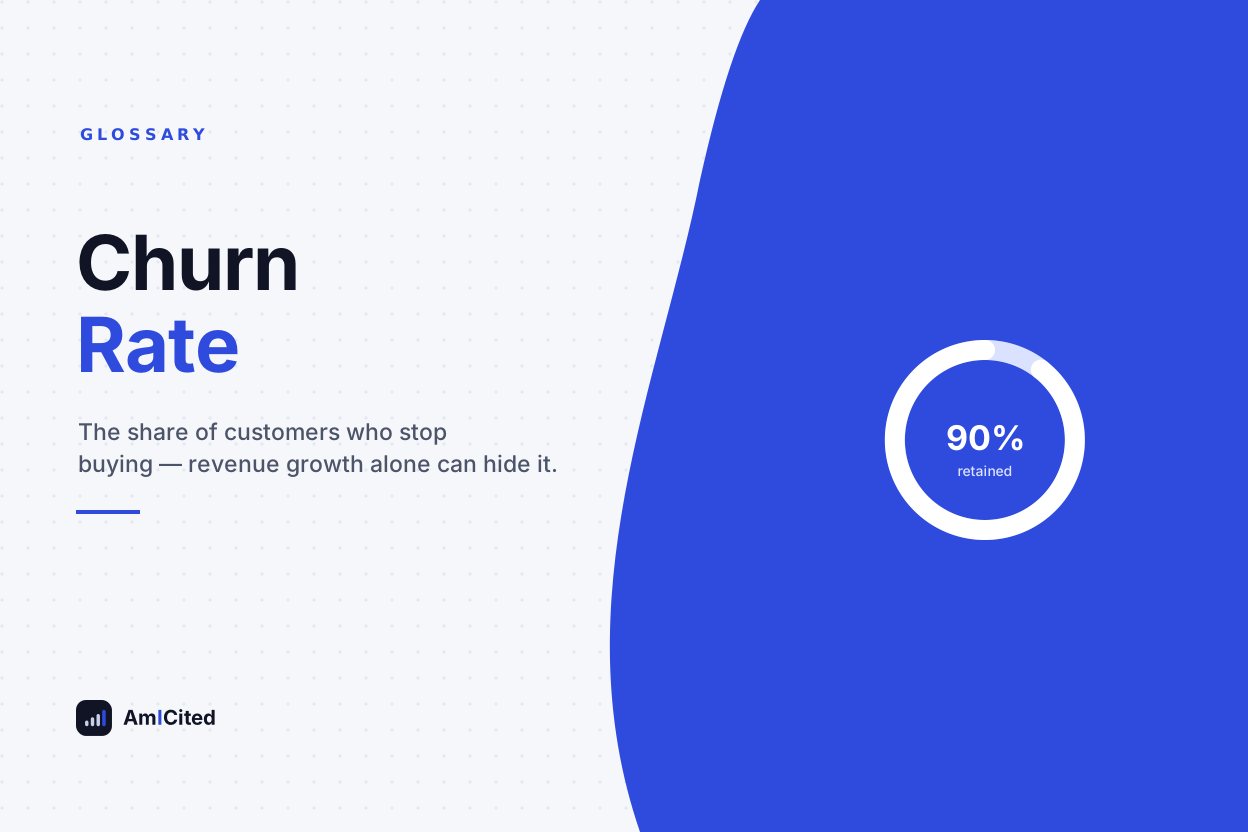
Churn Rate
Churn rate is the percentage of customers who stop purchasing from or subscribing to a business over a given period. In e-commerce, it typically measures the share of previously active customers who don't return within a defined window, and it is the direct counterpart to customer retention. Lower churn generally means existing revenue compounds instead of leaking away, which reduces reliance on constant new customer acquisition.
Definition of Churn Rate
Churn rate is the percentage of a business’s customers who stop buying, or stop subscribing, over a defined period of time. It’s one of the clearest signals of whether a business is actually retaining the value it works to acquire, because it measures loss directly rather than inferring health from top-line revenue growth alone. A store can grow revenue every quarter through aggressive new-customer acquisition while still having a serious churn problem underneath — the growth simply masks the leak. Churn rate is most commonly associated with subscription businesses, where a cancellation event makes churn unambiguous, but the concept applies just as usefully to any e-commerce business once an “active” window is defined for what counts as a still-engaged customer.
How Churn Rate Is Calculated
The basic formula is:
Churn Rate = (Customers Lost During Period ÷ Customers at Start of Period) × 100
For a subscription business, “lost” customers are simply those who cancel. For a non-subscription store, a customer is typically considered churned if they don’t make another purchase within a defined active window — often set based on the category’s typical repurchase cycle. A grocery or consumables brand might use a 60- or 90-day window, while a furniture or big-ticket goods brand might reasonably use a much longer window, since customers naturally buy less often.
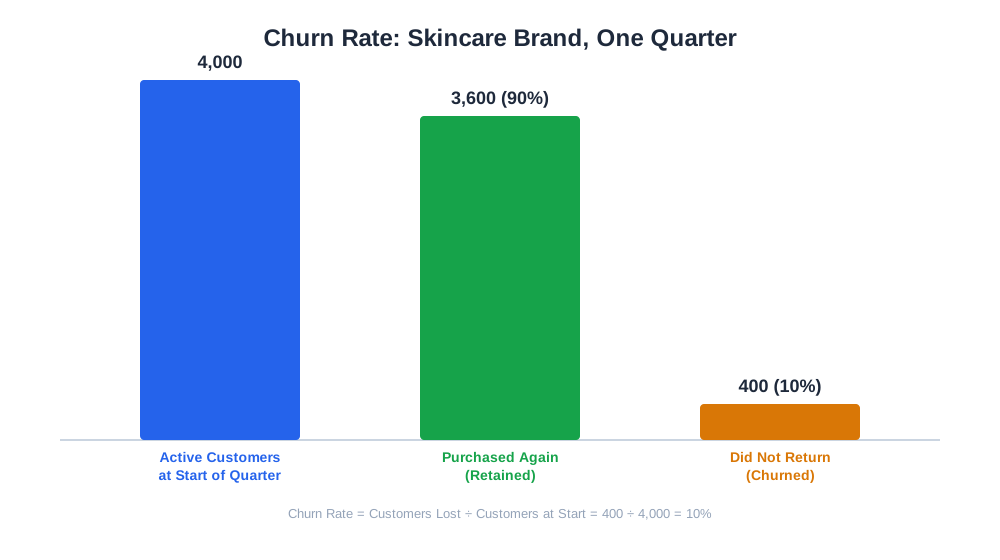
As a worked example: a skincare brand starts the quarter with 4,000 customers considered active (they purchased within the trailing 90 days). By the end of the quarter, 3,600 of those customers have purchased again within their own rolling 90-day window, and 400 have not. Churn rate for that cohort is 400 ÷ 4,000 = 10%.

Ready to Monitor Your AI Visibility?
Track how AI chatbots mention your brand across ChatGPT, Perplexity, and other platforms.
Why Churn Rate Matters for E-commerce Brands
Acquiring a new customer is almost always more expensive than keeping an existing one, so a high churn rate forces a brand to run faster just to stand still — replacing lost revenue with new acquisition spend instead of compounding the value of customers already won. Over time, even a modest reduction in churn rate can meaningfully increase customer lifetime value and reduce blended customer acquisition cost, because retained customers convert on repeat purchases without needing another round of paid marketing.
Churn rate is also an early warning system. A rising churn rate often shows up in retention data well before it shows up as a revenue problem, because new customer acquisition can temporarily offset the loss. Brands that only watch top-line revenue can miss a churn trend for months.
Churn Rate vs. Related Retention Metrics
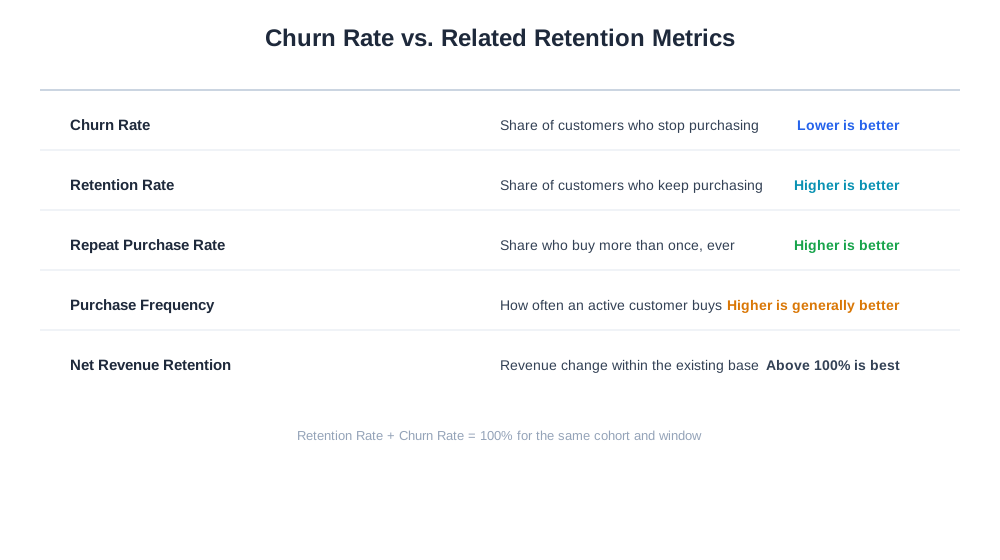
| Metric | What It Measures | Direction of “Good” |
|---|---|---|
| Churn Rate | Share of customers who stop purchasing | Lower is better |
| Retention Rate | Share of customers who keep purchasing | Higher is better |
| Repeat Purchase Rate | Share of customers who buy more than once, ever | Higher is better |
| Purchase Frequency | How often an active customer buys | Higher is generally better |
| Net Revenue Retention | Revenue change within the existing customer base | Above 100% is best |
Stay Updated on AI Visibility Trends
Get the latest insights on AI mentions, brand monitoring, and optimization strategies.
Churn Rate and AI-Driven Commerce
As AI shopping assistants like ChatGPT Shopping and Perplexity Shopping start influencing where repeat purchases happen, churn takes on a new dimension: a brand can lose a previously loyal customer not because of dissatisfaction, but because an AI assistant surfaced a comparable product from a competitor at the exact moment the customer was ready to reorder. This makes retention efforts that used to be “good enough” — a generic email reminder, an occasional discount — less reliable, since the AI-mediated decision point happens earlier and outside the brand’s direct channels.
Understanding churn requires visibility into who is actually coming back, not just how many total orders a store processes. AmICited’s eshop_get_retention tool tracks how customer cohorts behave over time within a connected store, surfacing which segments are retaining well and which are quietly churning, so a merchant can act on the trend rather than discovering it in a slow quarter.
Best Practices for Reducing Churn Rate
- Define an active-customer window that matches your category’s natural repurchase cycle, rather than borrowing a generic 30- or 90-day standard from an unrelated industry
- Segment churn analysis by customer cohort, acquisition channel, and first-purchase product, since churn drivers often differ across these groups
- Build post-purchase engagement (order updates, usage tips, replenishment reminders) into the customer lifecycle rather than relying only on acquisition marketing
- Watch churn rate trends monthly, not just at year-end, so a worsening trend can be caught while it’s still small
- Pair churn analysis with direct customer feedback (returns, support tickets, reviews) to understand the “why” behind the number, not just the rate itself
Common Churn Rate Mistakes
A frequent mistake is applying the same active-customer window to every product category in a diverse catalog. A brand selling both consumables and durable goods will see artificially inflated churn if it uses a short window suited to the consumables side across the entire customer base — the fix is defining category-specific active windows before calculating an aggregate figure.
Another common issue is treating churn rate as a lagging report rather than an operational metric. Reviewing it once a quarter means a churn spike caused by a shipping delay or a product quality issue two months ago is only discovered well after the damage has compounded — more frequent monitoring catches problems while they’re still small.
Some brands also calculate churn without segmenting by acquisition channel, which hides that customers acquired through one channel (say, a heavy discount promotion) churn at a much higher rate than customers acquired organically. Blending these together produces an average that doesn’t point to any actionable fix, whereas channel-level churn data usually does.