


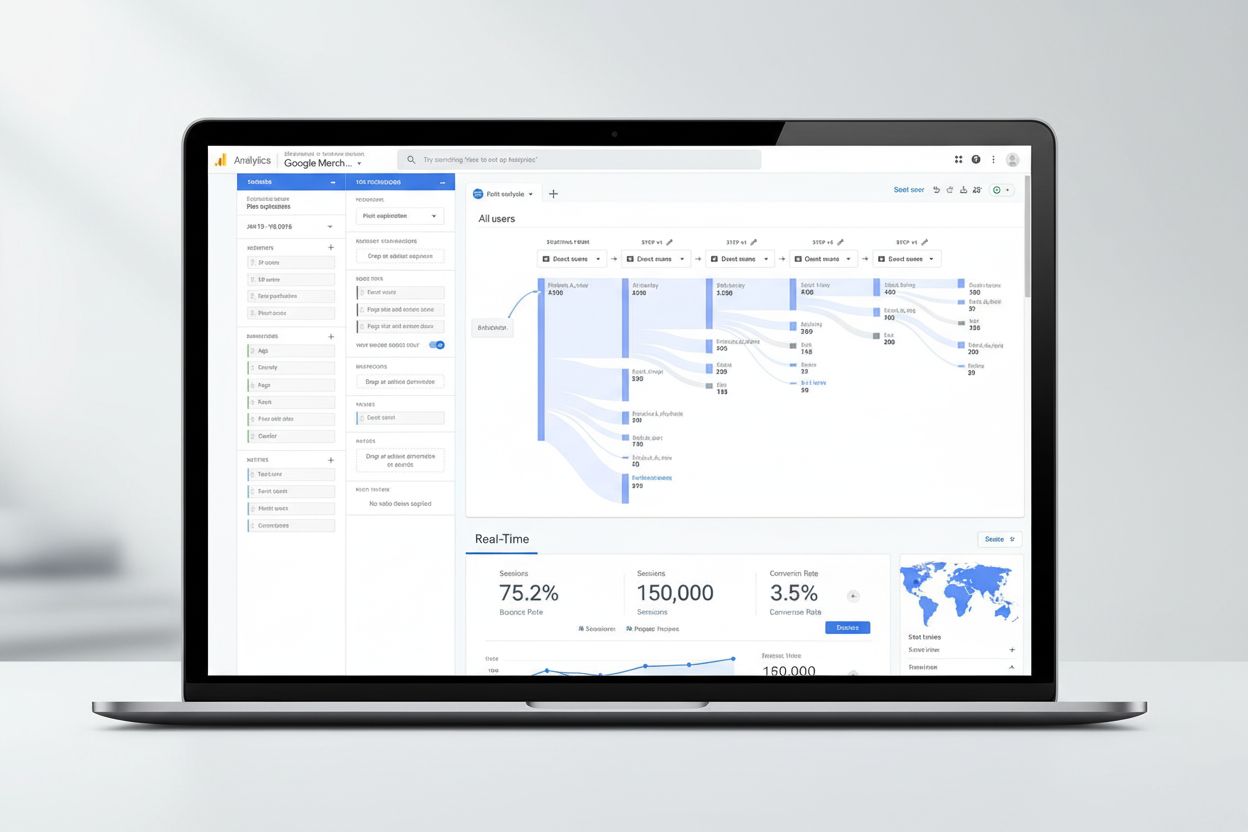
Google Analytics
Google Analytics is Google's free web analytics platform tracking website traffic, user behavior, and conversions. Learn how it works, key metrics, GA4 features...
12 min read
Google Trends is a free, publicly available tool that analyzes a sample of Google search queries to display the relative popularity of search terms over time, by geographic location, and across different categories. It provides real-time and historical data on search interest, enabling users to identify emerging topics, seasonal patterns, and consumer behavior shifts.
Google Trends is a free, publicly available tool that analyzes a sample of Google search queries to display the relative popularity of search terms over time, by geographic location, and across different categories. It provides real-time and historical data on search interest, enabling users to identify emerging topics, seasonal patterns, and consumer behavior shifts.
Google Trends is a free, publicly accessible analytics platform that measures and visualizes the relative popularity of search queries across Google Search, Google News, Google Shopping, and YouTube. Launched in 2012, Google Trends analyzes a representative sample of billions of daily Google searches to provide insights into what people are searching for in real time and historically. The tool displays search interest data on a normalized scale from 0 to 100, where 100 represents the peak popularity of a search term during the selected time period and geographic region. Google Trends enables marketers, researchers, journalists, policymakers, and business strategists to identify emerging topics, understand consumer behavior patterns, track seasonal demand fluctuations, and make data-driven decisions about content strategy, product development, and market positioning.
Google Trends emerged in 2006 as a simple tool to visualize search volume patterns, but it was significantly enhanced and publicly launched in its current form in 2012. The platform has evolved from a basic trend visualization tool into a sophisticated analytics instrument used by over 5 million users monthly across newsrooms, enterprises, academic institutions, and government agencies worldwide. The tool’s development reflected growing recognition that search behavior serves as a real-time proxy for public interest, consumer demand, and emerging societal concerns. According to research from the Google News Lab, Google Trends data has been instrumental in identifying disease outbreaks, predicting economic indicators, and understanding political engagement patterns. The platform’s integration with Google’s broader ecosystem—including Google Search, YouTube, and Google Shopping—has made it increasingly valuable for comprehensive market analysis. In 2024, Google introduced the Google Trends API (in alpha), enabling programmatic access to search trend data for enterprise applications, further expanding the tool’s utility for organizations requiring automated, scalable trend monitoring.

Track how AI chatbots mention your brand across ChatGPT, Perplexity, and other platforms.
Google Trends operates by sampling a large, representative subset of Google searches rather than analyzing the complete search dataset. This sampling approach is necessary because Google processes over 8.5 billion searches daily, making real-time analysis of complete data computationally prohibitive. The platform employs sophisticated data normalization techniques to ensure comparability across different search terms, time periods, and geographic regions. Each data point is divided by the total searches of the geography and time range it represents, then scaled on a 0-100 index where the highest search interest point equals 100. This normalization prevents regions with higher absolute search volumes from always appearing at the top of rankings. Google Trends also applies temporal filtering to eliminate duplicate searches from the same user within short periods, ensuring that artificial inflation from repeated queries doesn’t distort trend analysis. The platform categorizes searches into topics using Google’s knowledge graph and machine learning algorithms, allowing users to search for concepts rather than just literal keyword phrases. Geographic data is available at multiple granularities—worldwide, country, region, city, and metro area levels—enabling hyper-localized trend analysis. The tool provides both interest over time graphs showing relative popularity trends and interest by location maps displaying geographic distribution of search interest.
| Feature | Google Trends | Google Keyword Planner | SEMrush | Ahrefs |
|---|---|---|---|---|
| Cost | Free | Free (with Google Ads account) | Paid subscription | Paid subscription |
| Data Type | Relative search interest (0-100 index) | Estimated monthly search volume | Absolute search volume + keyword difficulty | Absolute search volume + competition metrics |
| Real-Time Data | Yes (nearly real-time) | Monthly averages | Updated regularly | Updated regularly |
| Geographic Granularity | City-level available | Country/region level | Country/region level | Country/region level |
| Historical Data | 2004-present | Limited historical data | 5+ years | 5+ years |
| Primary Use Case | Trend identification & consumer interest | Advertising campaign planning | SEO & competitive analysis | SEO & backlink analysis |
| API Access | Yes (Google Trends API - alpha) | Yes (Google Ads API) | Yes (SEMrush API) | Yes (Ahrefs API) |
| Seasonal Pattern Detection | Excellent | Good | Good | Moderate |
| Rising/Breakout Searches | Yes (with 5000%+ growth indicator) | No | Yes | No |
| Related Queries | Yes (top and rising) | Limited | Yes | Limited |
Get the latest insights on AI mentions, brand monitoring, and optimization strategies.
Understanding how to correctly interpret Google Trends data is critical for avoiding misinterpretation. The indexed 0-100 scale does not represent absolute search volume; rather, it shows relative popularity within the selected parameters. When comparing multiple search terms simultaneously, the scale recalibrates so that the term with the highest search interest receives a score of 100, and all other terms are indexed proportionally. This means that comparing “iPhone” and “iPhone 15” over the same time period will show different index values than comparing each term individually over different time periods. Google Trends also distinguishes between topics and search terms, with topics being more comprehensive and reliable for analysis. Topics pull in exact phrases, misspellings, acronyms, and all language variations, making them superior for global trend analysis. The platform’s normalization methodology accounts for population differences between regions, ensuring that a country with 10 million people doesn’t automatically rank higher than a country with 100 million people simply due to absolute search volume. Google Trends data reflects searches made on Google Search, YouTube, Google News, and Google Shopping, but excludes searches from Google products’ internal systems, including AI Mode and AI Overviews. This exclusion is intentional to maintain data integrity and prevent internal Google system queries from skewing public trend analysis.
Google Trends has become indispensable for strategic business decision-making across multiple industries. In content marketing, organizations use Google Trends to identify high-interest topics aligned with audience search behavior, ensuring content investments target genuine consumer demand. Media companies and newsrooms leverage the tool to identify emerging stories before they reach mainstream coverage, enabling competitive advantage in news discovery. E-commerce businesses utilize Google Trends to forecast seasonal demand patterns, optimize inventory management, and time product launches to coincide with peak search interest periods. The tool’s rising searches feature reveals emerging consumer interests with growth rates exceeding 5,000%, enabling first-mover advantage in addressing new market opportunities. Market researchers employ Google Trends to validate hypotheses about consumer behavior, track competitive positioning, and identify geographic markets with disproportionate interest in specific products or services. Political campaigns and policy organizations use Google Trends to understand public concern about specific issues, measure campaign message resonance, and identify emerging voter priorities. Healthcare organizations monitor Google Trends to identify disease outbreaks, track public health concerns, and understand patient information-seeking behavior. The OECD Weekly Tracker demonstrates Google Trends data’s macroeconomic predictive power, using search patterns to estimate weekly GDP and economic activity in real time.
As artificial intelligence increasingly mediates consumer discovery through platforms like ChatGPT, Perplexity, Google AI Overviews, and Claude, understanding Google Trends data becomes essential for comprehensive brand monitoring. Traditional Google Trends analysis shows where consumers are searching, but it doesn’t reveal whether brands appear in AI-generated responses to those searches. Organizations must now integrate Google Trends analysis with AI search monitoring tools to understand the complete discovery landscape. For example, if Google Trends shows rising search interest in “sustainable fashion brands,” but brand monitoring reveals minimal mentions in AI responses about sustainable fashion, this gap represents a critical visibility opportunity. Google Trends data also helps contextualize AI monitoring results—if a brand appears frequently in AI responses for a search term with declining Google Trends interest, this may indicate the brand is over-represented relative to actual consumer demand. The relationship between Google Trends and AI Overviews is particularly important, as Google’s AI-powered search results increasingly influence consumer behavior. Brands that understand both Google Trends patterns and their visibility in AI Overviews can optimize their content strategy to capture demand across both traditional and AI-mediated search channels.
Effective use of Google Trends requires understanding several best practices to maximize analytical value. First, always compare like with like—topics should be compared with other topics, and search terms should be compared with other search terms, as mixing these categories produces unreliable comparisons. Second, use appropriate time ranges for your analysis; short time ranges (7 days or less) display data in local time zones, while longer ranges use UTC, affecting interpretation of real-time vs. historical patterns. Third, combine multiple data sources—Google Trends should be paired with Google Analytics, Google Search Console, social media analytics, and market research to create comprehensive insights. Fourth, account for seasonality by comparing year-over-year data rather than month-to-month, which often reveals artificial patterns caused by seasonal fluctuations. Fifth, validate findings with additional research; a spike in Google Trends interest doesn’t necessarily indicate a “winning” topic—it simply shows increased search volume, which may reflect negative news, controversy, or temporary viral moments. Sixth, monitor related queries and rising searches to identify adjacent opportunities and emerging variations of your primary search terms. Finally, use geographic filtering to identify regional variations in search interest, enabling localized marketing strategies and market-specific product development.
Run this process quarterly to check whether content investment actually matches search demand. Step 1: Pull topic-level trend lines, not keyword-level. Search your core subject areas as topics (not literal search terms) over a 12-24 month window, since topics capture misspellings and language variants that literal keyword matching misses—this avoids under-counting demand for a subject your content already targets. Step 2: Compare year-over-year, not month-to-month. Overlay the current year against the prior year for the same date range to separate genuine growth or decline from ordinary seasonal fluctuation. Step 3: Cross-check against your published content calendar. For each topic showing rising or breakout interest (5,000%+ growth), verify you have content live and indexed for it; for topics showing flat or declining interest where you’ve invested heavily, flag them for reassessment. Step 4: Check the related and rising queries panel for each core topic to catch adjacent terms you haven’t covered yet—this is where genuinely new content gaps surface, rather than in your existing keyword list. Step 5: Filter by your actual geographic markets, not worldwide default, since national or global aggregates can mask strong regional demand that a location-specific business should be targeting. Step 6: Export the data and lay it against Search Console impressions for the same terms—a gap where Trends shows rising interest but Search Console shows flat impressions indicates a visibility problem worth investigating, not a demand problem.
Start tracking how AI chatbots mention your brand across ChatGPT, Perplexity, and other platforms. Get actionable insights to improve your AI presence.
Google Analytics is Google's free web analytics platform tracking website traffic, user behavior, and conversions. Learn how it works, key metrics, GA4 features...
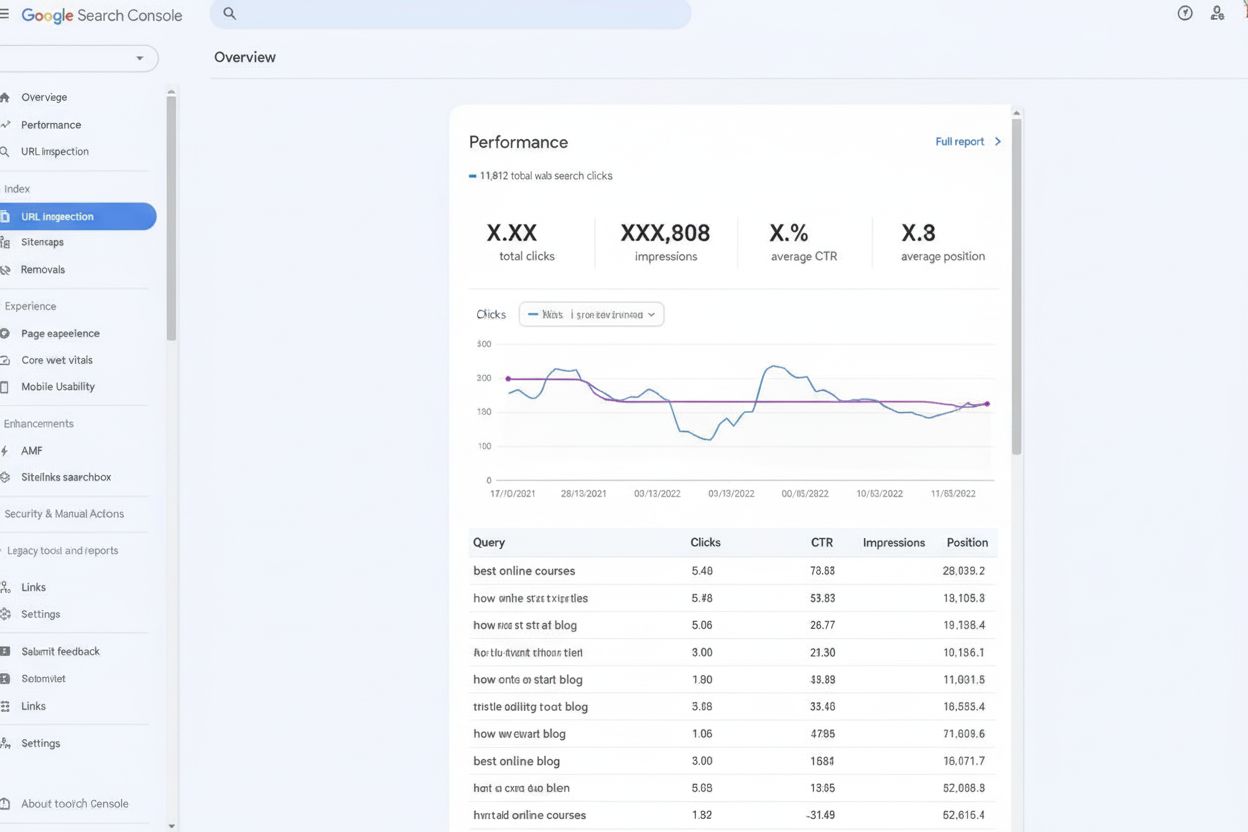
Google Search Console is Google's free webmaster platform for monitoring search performance, tracking indexing status, and fixing SEO issues. Learn how GSC help...

Google News is an AI-powered news aggregation platform that ranks and distributes news content from publishers globally. Learn how it works, ranking factors, an...
Cookie Consent
We use cookies to enhance your browsing experience and analyze our traffic. See our privacy policy.