


Return Rate
Return rate is the percentage of sold units or orders that customers send back to a store, calculated by dividing returned units by total units sold over a given period. It's a key indicator of product fit, sizing accuracy, and overall customer satisfaction, and it directly affects contribution margin.
Definition of Return Rate
Return rate measures the proportion of purchased products that customers send back to a store, typically expressed as a percentage of units sold or orders placed over a given period. Returns happen for many reasons — the product didn’t fit, didn’t match its description, arrived damaged, or simply didn’t meet expectations — and return rate serves as a summary signal for how well a store’s product pages, sizing guidance, and quality control are working. A low return rate generally indicates customers are getting an accurate sense of what they’re buying before they check out; a high or rising return rate signals a gap between expectation and reality somewhere in the buying experience.
How Return Rate Is Calculated
The basic formula:
Return Rate = Returned Units ÷ Units Sold × 100
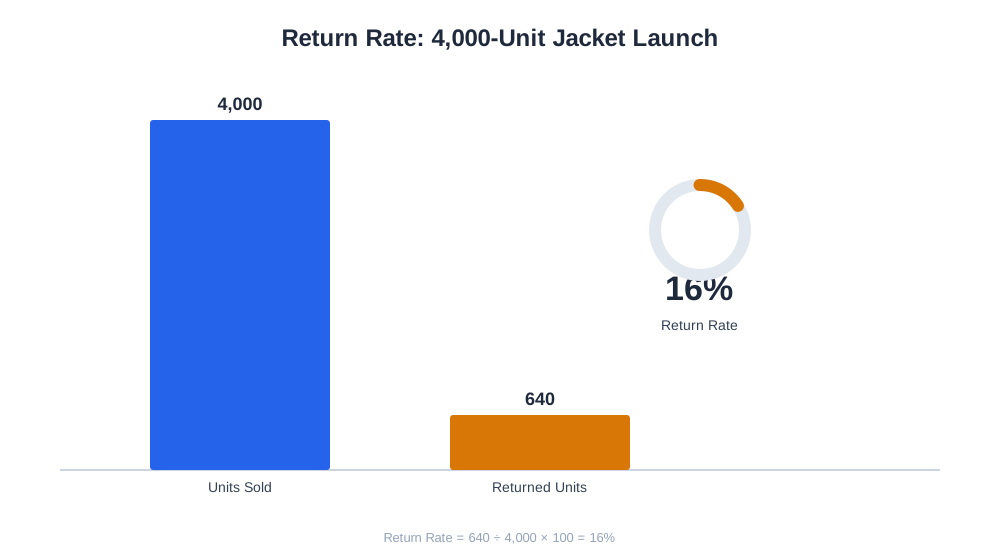
A worked example: an apparel brand sells 4,000 units of a new jacket in a month and receives 640 returns over the following weeks. Return rate = 640 ÷ 4,000 × 100 = 16%.
Return rate can also be calculated by revenue rather than units, which weights the calculation by dollar value: if those 640 returned jackets average $80 each ($51,200 in returned revenue) against $320,000 in total jacket revenue, the revenue-based return rate is 51,200 ÷ 320,000 × 100 = 16% as well in this case — but the two figures diverge whenever higher- or lower-priced variants are returned disproportionately. If only the premium, higher-priced color option is driving most returns, the revenue-based return rate will run higher than the unit-based rate, revealing a more concentrated financial impact than the unit count alone suggests.

Ready to Monitor Your AI Visibility?
Track how AI chatbots mention your brand across ChatGPT, Perplexity, and other platforms.
Why Return Rate Matters for E-commerce Brands
Return rate has a direct and often underestimated effect on profitability. Beyond the lost sale itself, each return typically carries return shipping costs, restocking labor, and — depending on the product category — a real chance the returned item can’t be resold at full price, sometimes at all. These costs erode contribution margin on the affected SKUs, and in categories with thin margins to begin with, a high return rate can turn an apparently profitable product into a marginal one once the full cost of returns is factored in.
Return rate is also a leading indicator of customer satisfaction and product-market fit. A new product launch with an unusually high early return rate is often signaling a sizing issue, a misleading product photo, or a quality problem — catching that signal early, before it shows up in reviews or repeat-purchase decline, gives a merchant time to fix the product page or the product itself.
Return Rate Benchmarks by Category
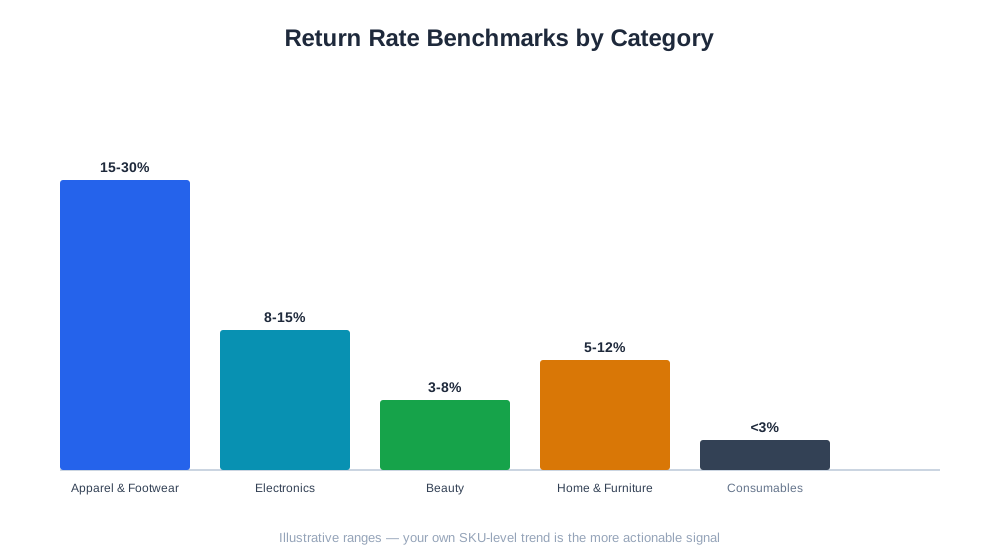
| Category | Typical Return Rate Range | Primary Driver |
|---|---|---|
| Apparel & footwear | 15-30% | Fit and sizing uncertainty |
| Electronics | 8-15% | Buyer’s remorse, compatibility issues |
| Beauty & personal care | 3-8% | Shade or scent mismatch |
| Home goods & furniture | 5-12% | Shipping damage, size misjudgment |
| Consumables & food | Under 3% | Low return eligibility, low unit price |
These ranges are illustrative rather than fixed industry standards — a store’s own trend over time, and comparison across its own SKUs, is generally more actionable than a cross-category benchmark.
Stay Updated on AI Visibility Trends
Get the latest insights on AI mentions, brand monitoring, and optimization strategies.
Return Rate and AI-Driven Commerce
As AI shopping assistants increasingly answer detailed pre-purchase questions — sizing, materials, compatibility — on a customer’s behalf, the accuracy of the product data these assistants draw from becomes a real lever on return rate. A shopper who gets a clear, accurate answer about fit or compatibility from an AI assistant before buying is less likely to be surprised by the product on arrival than one who guessed from a vague product description. This makes structured, accurate product data an increasingly important return-reduction lever, not just an SEO one.
AmICited’s eshop_list_status_map tool tracks the full lifecycle of order statuses for connected stores, including returns, giving merchants visibility into return volume and patterns without needing to build custom reporting on top of raw order data.
Best Practices for Managing Return Rate
- Track return rate at the SKU level, not just store-wide, since a handful of problem products often drive a disproportionate share of total returns.
- Compare return rate by unit and by revenue to catch cases where higher-priced products are returned at a higher rate than the overall average suggests.
- Improve product page accuracy — sizing charts, multiple angles, honest fit and material descriptions — for any SKU with an above-average return rate.
- Analyze return reasons, not just return volume; “didn’t fit” and “arrived damaged” call for very different fixes.
- Factor return-related costs into contribution margin calculations rather than treating returns purely as a lost-sale figure.
Common Return Rate Mistakes
Tracking return rate only at the store level. A blended, store-wide return rate can look perfectly acceptable while hiding a handful of specific SKUs with return rates two or three times the average. Break the number out by product to find where the real problem sits.
Ignoring return reason data. Return rate alone tells you a return happened, not why. Without categorizing reasons — wrong size, damaged in transit, not as described — it’s difficult to know whether the fix is a better sizing chart, better packaging, or a product quality issue.
Treating all returns as pure revenue loss. Some returned inventory can be resold at full price with minimal cost; other returned inventory is a total write-off. Lumping every return into the same cost bucket overstates or understates the real financial impact depending on the category.
Reacting to a high return rate by removing the product entirely. Sometimes a high return rate is fixable with a better product page, more accurate sizing information, or improved packaging, rather than requiring the product to be discontinued. Diagnosing the root cause before cutting a SKU avoids losing a product that just needs better presentation.
Not accounting for return rate when calculating contribution margin. A product can look profitable using gross margin or even a naive contribution margin calculation that ignores return-related costs, then turn out to be marginal once restocking labor, return shipping, and unsellable inventory are properly included.