


RFM Analysis
RFM analysis is a customer segmentation method that scores each customer on three dimensions: Recency (how recently they purchased), Frequency (how often they purchase), and Monetary value (how much they spend). Combining these three scores groups customers into segments like loyal, at-risk, or lost, which drives targeted retention and marketing decisions. It's one of the oldest and most widely used segmentation frameworks in retail and ecommerce.
Definition of RFM Analysis
RFM analysis is a customer segmentation technique that scores each customer along three transaction-based dimensions: how Recently they last purchased, how Frequently they purchase, and how much Monetary value they’ve generated. The method dates back decades in direct-mail and catalog retail, long before ecommerce existed, because all three inputs can be derived from basic order history — no surveys, no third-party data, no complex modeling required. In modern ecommerce, RFM remains one of the most widely used segmentation frameworks precisely because of that simplicity: any store with an order database already has everything needed to calculate it. The output is a small number of customer segments — typically five to ten — that each represent a distinct behavioral profile a marketing or retention team can act on differently.
How RFM Scoring Works
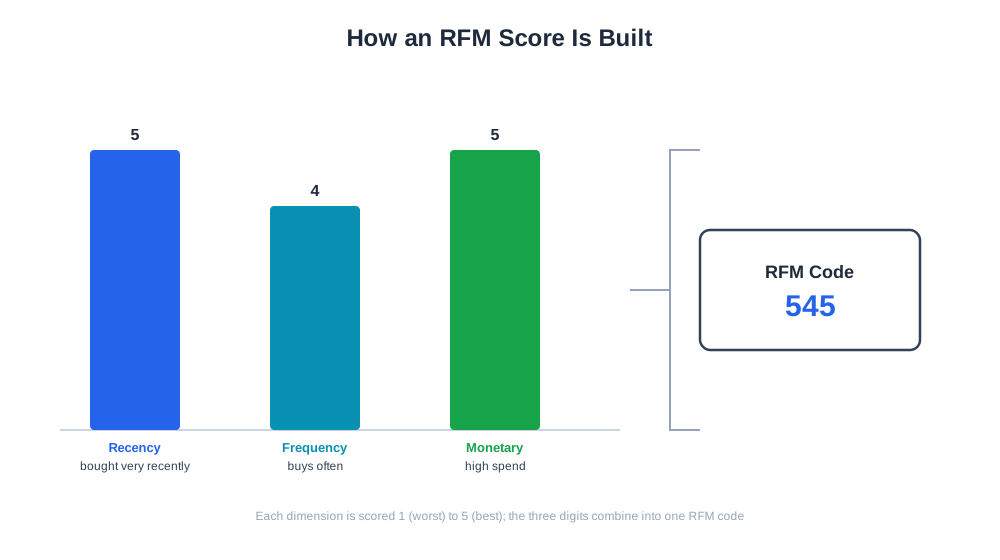
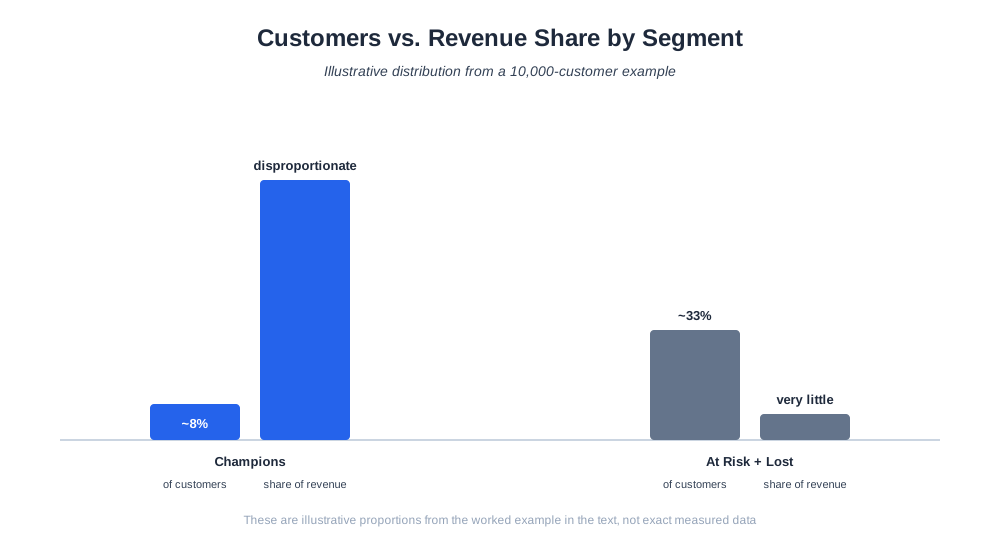
The standard approach ranks all customers against each other on each of the three dimensions and divides them into tiers, most commonly quintiles (five equal-sized groups), each assigned a score from 1 (worst) to 5 (best). A customer who purchased yesterday scores 5 on recency; one who hasn’t purchased in over a year might score 1. A customer who orders monthly scores high on frequency; one who’s ordered exactly once scores low. Monetary value is usually based on total or average order value over a defined lookback window, often the trailing 12 months. These three scores combine into a single RFM code — a customer scoring 5 on recency, 4 on frequency, and 5 on monetary value might be labeled “545.” From there, businesses map score combinations to named segments: a 5-5-5 customer is typically labeled a “Champion,” a customer who used to score high but now shows low recency is “At Risk,” and a customer with a single low-value purchase long ago is “Lost.” Consider a simplified example: a store with 10,000 customers might find that its top RFM tier (Champions, roughly 8% of customers) accounts for a disproportionate share of total revenue, while its bottom two tiers (At Risk and Lost, together perhaps a third of the customer base) contribute very little in a given month — illustrating why treating all customers identically wastes marketing spend on segments unlikely to respond.

Ready to Monitor Your AI Visibility?
Track how AI chatbots mention your brand across ChatGPT, Perplexity, and other platforms.
Why RFM Analysis Matters for Ecommerce Brands
Treating every customer the same in marketing and retention spend is inefficient: a re-engagement email that works on someone who purchased three weeks ago is unlikely to work the same way on someone who hasn’t ordered in over a year, and a loyalty discount aimed at a first-time buyer might actually be wasted on a customer who was already going to reorder anyway. RFM segmentation lets a business allocate retention budget where it has the best chance of changing behavior — reserving win-back discounts for customers showing early signs of drop-off rather than customers who are already lost causes, and reserving loyalty rewards for customers who are genuinely at risk of churning rather than customers who would have stayed regardless. It also gives finance and marketing teams a shared, simple vocabulary: “our At Risk segment grew 15% this quarter” is immediately actionable in a way that raw transaction counts are not.
RFM Segment Table
| Segment | Recency | Frequency | Monetary | Typical Action |
|---|---|---|---|---|
| Champions | High | High | High | Reward loyalty, ask for referrals |
| Loyal Customers | Medium-High | High | Medium-High | Upsell, early access to new products |
| Potential Loyalists | High | Low-Medium | Medium | Nurture toward repeat purchase |
| At Risk | Low | Medium-High | High | Win-back offer, personal outreach |
| Hibernating | Low | Low | Low-Medium | Low-cost reactivation, otherwise deprioritize |
| Lost | Very Low | Low | Low | Exclude from active campaigns, occasional broad reactivation only |
Stay Updated on AI Visibility Trends
Get the latest insights on AI mentions, brand monitoring, and optimization strategies.
RFM Analysis and AI-Driven Commerce
As ecommerce brands increasingly automate retention marketing, RFM segments have become a common input into rules-based and AI-driven campaign triggers — a customer crossing from “Loyal” into “At Risk” can automatically trigger a specific email flow without a human reviewing every account individually. AmICited’s eshop_get_segments tool builds this analysis directly into its eshop reporting suite, using RFM as its default customer segmentation axis so a merchant can see segment composition and movement without maintaining a separate spreadsheet model. Because segment transitions matter as much as static segment size — a customer moving from Champion to At Risk is a different signal than one who’s been At Risk for months — pairing RFM scoring with segment-transition tracking gives a clearer picture of where retention effort will have the most impact than a single snapshot of segment sizes alone.
Best Practices for RFM Analysis
- Recalculate scores on a regular cadence (commonly monthly) so segments reflect current behavior, not stale purchase history
- Use quintiles or another consistent scoring method rather than arbitrary cutoffs, so segments remain comparable over time
- Set the monetary and frequency lookback window to match your business’s natural purchase cycle — a 90-day window makes sense for consumables, less so for durable goods
- Pair RFM scores with segment-transition tracking, since a customer’s direction of movement is often more actionable than their current label alone
- Avoid over-segmenting; five to eight named segments are usually enough to drive distinct actions without overwhelming a marketing team
- Validate that top RFM segments actually correlate with revenue and margin contribution for your specific business before assuming the standard labels apply unchanged
Common RFM Analysis Mistakes
A frequent mistake is applying generic RFM thresholds copied from a blog post or another business without adjusting them to your own purchase cycle — a subscription box brand and a furniture retailer have wildly different natural repurchase intervals, and a recency scale built for one will misclassify customers of the other. The fix is deriving quintile boundaries from your own transaction data rather than importing fixed day-count thresholds. Another common issue is calculating RFM once and never refreshing it, which quietly turns a dynamic segmentation tool into a static, increasingly wrong customer list — a customer scored as “Champion” six months ago may have already churned. Scheduling automatic recalculation solves this. A third mistake is treating monetary value as lifetime total spend without normalizing for customer tenure, which unfairly ranks a two-year customer above a new customer who’s spending at a much higher rate per month; using an average order value or a fixed recent window instead of all-time total often gives a fairer picture. Finally, some businesses build RFM segments but never connect them to an actual campaign trigger, leaving the analysis as a report nobody acts on — the value of RFM comes from wiring segment membership (and segment transitions) directly into marketing automation, not from the scoring exercise itself.