


Break-Even Point
The break-even point is the sales volume or revenue level at which total revenue exactly equals total costs, meaning the business is neither making a profit nor a loss. For e-commerce brands, it's a foundational planning number used to set pricing, evaluate ad spend, and judge whether a new product or channel is financially sustainable.
Definition of Break-Even Point
The break-even point is the level of sales — expressed either in units sold or in total revenue — at which a business’s total revenue exactly covers its total costs, both fixed and variable. Below that point, the business operates at a loss; above it, every additional sale contributes toward actual profit. It’s one of the most fundamental financial planning concepts in any commerce business, because it translates abstract cost structures into a concrete, actionable number: “we need to sell X units before this product line makes money.”
How Break-Even Point Is Calculated
The standard formula for break-even point in units is:
Break-Even Point (units) = Fixed Costs ÷ (Price per Unit − Variable Cost per Unit)
The denominator, price minus variable cost, is the contribution margin per unit — how much each unit sold contributes toward covering fixed costs before any profit is realized.
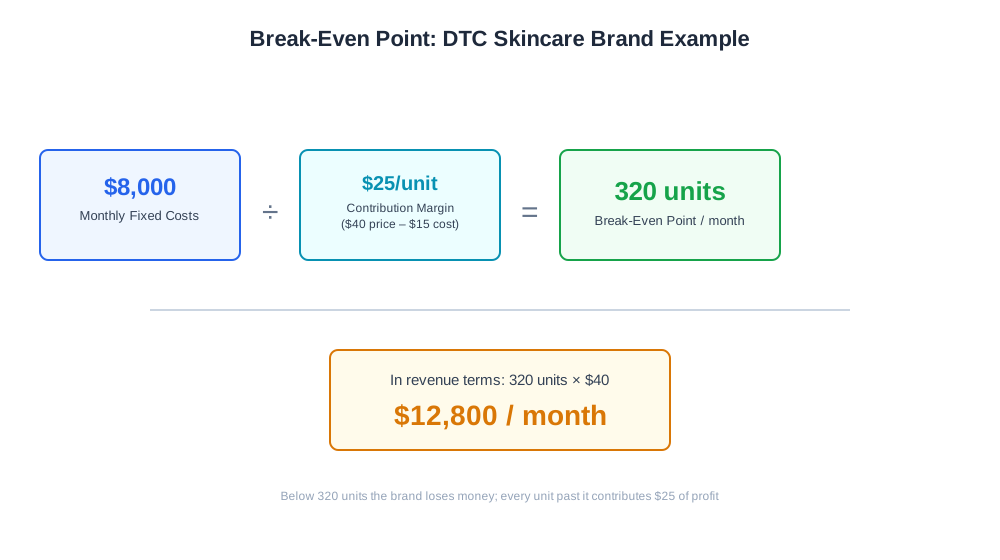
Worked example: a DTC skincare brand has monthly fixed costs (software, salaries, warehouse rent) of $8,000. Each product sells for $40 and costs $15 in variable costs (materials, packaging, payment processing, and per-unit shipping).
Contribution Margin per Unit = $40 − $15 = $25
Break-Even Point (units) = $8,000 ÷ $25 = 320 units per month
To express this in revenue terms:
Break-Even Point (revenue) = 320 units × $40 = $12,800 per month
Selling fewer than 320 units in a month means the brand is operating at a loss that month; selling more means every additional unit sold contributes $25 of actual profit.

Ready to Monitor Your AI Visibility?
Track how AI chatbots mention your brand across ChatGPT, Perplexity, and other platforms.
Why Break-Even Point Matters for E-commerce Brands
Break-even analysis turns pricing and spending decisions into concrete tradeoffs rather than guesswork. Before launching a new product, a merchant can ask: at this price and this cost structure, how many units do we realistically need to sell each month to avoid losing money — and is that volume achievable given our traffic and conversion rate? If the break-even volume looks unrealistic against current demand, that’s a signal to revisit pricing, cost structure, or the decision to launch at all, before money is spent building and stocking the product.
The same logic applies to marketing spend. If a paid acquisition channel costs more per customer than the contribution margin that customer generates before covering fixed costs, scaling that channel further pushes the break-even point higher rather than closer, even if top-line revenue looks like it’s growing.
Break-Even Point in Practice: A Comparison
| Scenario | Fixed Costs | Contribution Margin/Unit | Break-Even (units) |
|---|---|---|---|
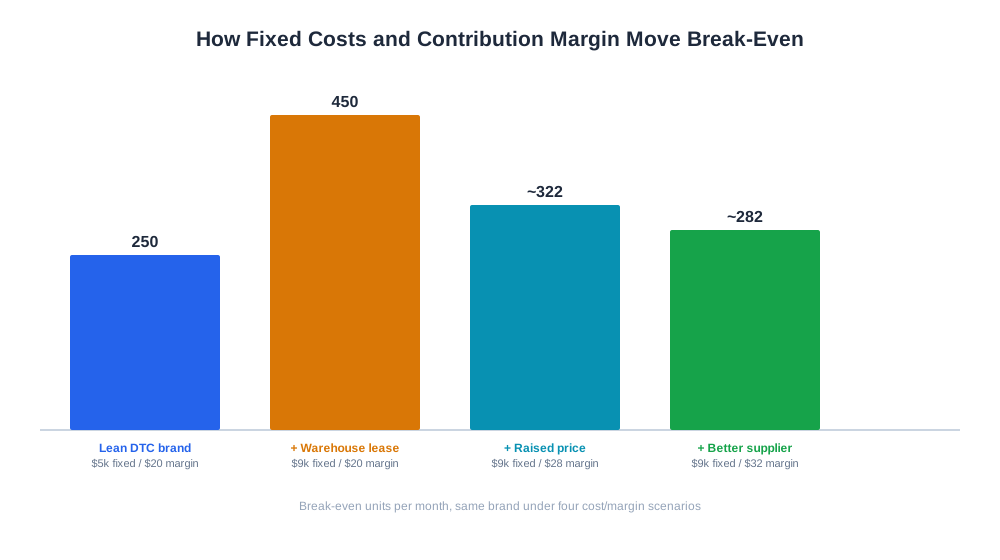
| Lean DTC brand, low overhead | $5,000/mo | $20 | 250 units/mo |
| Same brand, added a warehouse lease | $9,000/mo | $20 | 450 units/mo |
| Same brand, raised price and margin | $9,000/mo | $28 | ~322 units/mo |
| Same brand, cut variable cost via better supplier terms | $9,000/mo | $32 | ~282 units/mo |
This illustrates the core lever structure: break-even point rises with fixed costs and falls as contribution margin per unit improves, whether through pricing, supplier negotiation, or cost efficiency.
Stay Updated on AI Visibility Trends
Get the latest insights on AI mentions, brand monitoring, and optimization strategies.
Break-Even Point and AI-Driven Commerce
Break-even analysis doesn’t have a direct AI-shopping-assistant angle, but it underpins a decision that increasingly does: whether a product is worth actively promoting for visibility in AI shopping assistants like ChatGPT Shopping or Perplexity Shopping in the first place. A product with a break-even volume that’s already hard to hit through existing channels is a weak candidate for additional investment in AI-visibility optimization, since the underlying unit economics haven’t been proven yet.
AmICited’s eshop_get_profit_plan tool helps close this loop by tracking a merchant’s stated profit target against actual performance over time, giving a live view of how sales volume is tracking relative to the break-even threshold and the profit goal beyond it. That makes it easier to judge, in near real time, whether a given month’s marketing or AI-visibility investment is actually moving the business past break-even rather than just increasing revenue without improving the underlying economics.
Best Practices for Break-Even Analysis
- Categorize costs carefully as fixed or variable before calculating; miscategorized ad spend or shipping is a common source of an inaccurate number
- Recalculate break-even any time a major cost input changes — supplier pricing, shipping rates, or ad costs per acquisition
- Calculate break-even at the product or product-line level for multi-product catalogs, not just company-wide
- Compare break-even volume against realistic traffic and conversion assumptions before committing to a new product or channel
- Revisit break-even alongside contribution margin whenever considering a price change, since the two move together
- Use break-even as a gating check before scaling ad spend on a channel, not just a retrospective reporting number
Common Break-Even Point Mistakes
A common mistake is miscategorizing costs — treating a cost that scales with sales volume (like a percentage-based payment processing fee) as fixed, or a genuinely fixed cost (like software subscriptions) as variable — which distorts the break-even calculation in either direction. Another frequent issue is calculating break-even once at product launch and never revisiting it, even after supplier costs, shipping rates, or ad costs per acquisition have shifted meaningfully since then. Some businesses calculate break-even only at the company level, missing that a specific underperforming product line is dragging down overall profitability while a strong seller masks the problem in aggregate reporting. It’s also common to ignore break-even entirely when evaluating a new marketing channel, scaling spend purely based on top-line revenue growth without checking whether the channel’s cost per acquisition is compatible with the product’s actual contribution margin. Finally, some brands treat reaching break-even as a finish line rather than a floor, losing urgency on growth and efficiency improvements right at the point where every additional sale starts generating real profit.