


Cohort Analysis
Cohort analysis is a method of grouping customers by a shared starting point, most commonly the month or week they made their first purchase, and then tracking how that group's behavior evolves over time compared to other cohorts. It reveals trends in retention, spending, and churn that a single aggregate metric averaged across all customers would hide.
Definition of Cohort Analysis
Cohort analysis is a method for understanding customer behavior by grouping people according to a shared starting point in time, most commonly the month or week of their first purchase, and then tracking how each group behaves in the months that follow. Instead of looking at a single blended retention or spend number across an entire customer base, cohort analysis separates customers into “cohorts” so that trends over time become visible: are customers acquired more recently sticking around longer than customers acquired a year ago, or is retention quietly getting worse even while total revenue keeps growing because new customer acquisition is masking the decline? Cohort analysis is a standard technique in subscription businesses, but it applies just as directly to ecommerce, where the relevant behavior is usually repeat purchase, retention, or cumulative spend rather than subscription renewal.
How Cohort Analysis Works
Building a cohort analysis starts with defining the cohort grouping, most often the calendar month a customer placed their first order. Each customer is assigned to exactly one cohort based on that first purchase date. From there, for every month after acquisition, the analysis calculates what percentage of that cohort made another purchase, or how much revenue that cohort generated, forming a grid with cohorts as rows and “months since acquisition” as columns.
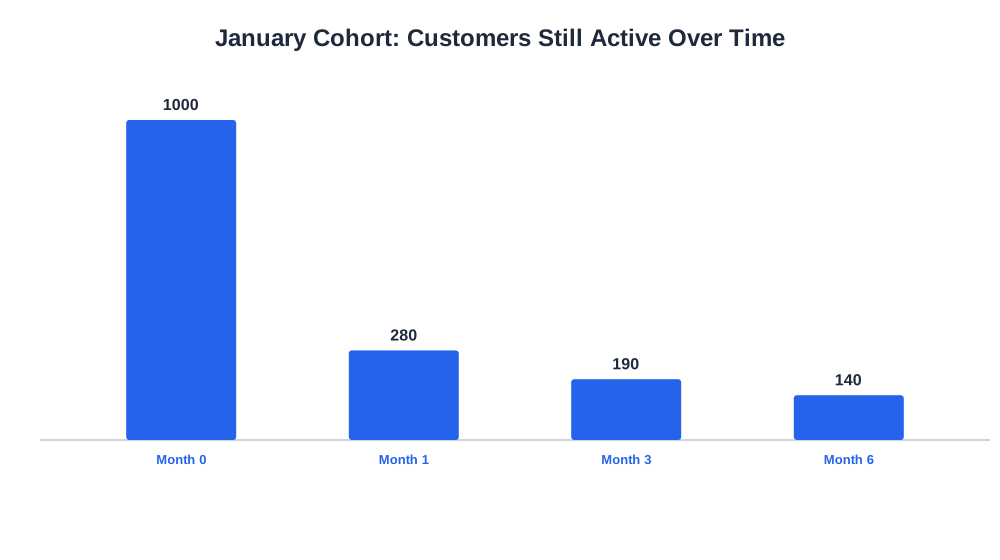
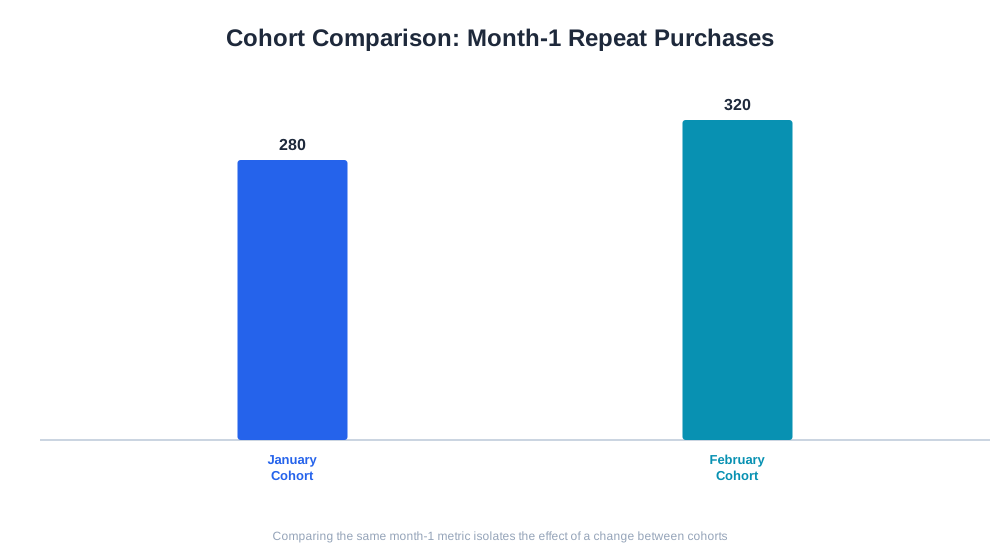
A worked example: a store acquires 1,000 new customers in January. Of those, 280 make a second purchase within their first month after acquisition (month 1), 190 are still active by month 3, and 140 remain active by month 6. The store repeats this same tracking for its February cohort, its March cohort, and so on. If the February cohort shows 320 customers still active by month 1 instead of January’s 280, that’s a meaningful signal, retention is improving, and it’s worth investigating what changed between January and February, whether it was a new acquisition channel, an onboarding email sequence, or a pricing change.

Ready to Monitor Your AI Visibility?
Track how AI chatbots mention your brand across ChatGPT, Perplexity, and other platforms.
Why Cohort Analysis Matters for E-commerce Brands
Aggregate metrics like a single blended retention rate or average customer lifetime value can hide important trends because they average behavior across customers acquired at very different times, under very different conditions. A store whose overall retention number looks stable might actually have improving retention among new cohorts offset by declining retention among older cohorts churning out, a distinction with very different strategic implications. Cohort analysis makes the effect of specific changes visible and attributable: if a brand changes its onboarding email sequence in March, comparing the March cohort’s month-1 repeat purchase rate against the February cohort isolates the effect of that specific change far more cleanly than watching the blended monthly retention number, which mixes old and new customers together.
Comparison Table: Cohort Analysis vs. Other Customer Analytics Approaches
| Approach | What It Measures | Time Dimension | Best For |
|---|---|---|---|
| Cohort Analysis | How groups acquired at different times behave over time | Explicit, by acquisition period | Isolating effects of acquisition or product changes |
| RFM Analysis | Recency, frequency, monetary value at a point in time | Snapshot, not time-series | Segmenting the current customer base for targeting |
| Churn Rate | Share of customers lost over a period | Aggregate across all customers | High-level health check |
| Lifetime Value (LTV) | Total expected revenue per customer | Can be cohort-based or blended | Justifying acquisition spend |
| Customer Segmentation | Groups sharing behavioral or demographic traits | Snapshot or ongoing | Targeting messaging and offers |
Stay Updated on AI Visibility Trends
Get the latest insights on AI mentions, brand monitoring, and optimization strategies.
Cohort Analysis and AI-Driven Commerce
Cohort analysis is primarily an internal analytics discipline rather than something AI shopping assistants interact with directly, but it plays a role in how brands evaluate the customers those assistants bring in. As more purchase volume originates from AI-mediated discovery, whether through ChatGPT Shopping, Perplexity Shopping, or AI-driven product recommendations, brands increasingly want to know whether customers acquired through those channels retain and spend differently than customers acquired through traditional search or paid social. Building a cohort specifically around acquisition source, including AI-referred traffic, lets a brand answer that question directly rather than guessing from a single blended retention number.
AmICited’s eshop_get_retention and eshop_get_ltv tools are both structured around acquisition cohorts by design, tracking how each month’s new customers retain and accumulate value over time. That structure makes it straightforward to compare, for example, whether customers acquired in a month with a major AI-visibility campaign show a different retention curve than customers acquired the prior month, without needing to build the cohort logic manually from raw order exports.
Best Practices for Cohort Analysis
- Define cohorts by a consistent, meaningful event, most commonly first purchase month, and keep that definition stable across the reporting period so cohorts remain comparable
- Track more than one metric per cohort where possible, such as repeat purchase rate and cumulative spend, since a cohort can retain well while spending less, or vice versa
- Compare cohorts against specific known changes (new acquisition channel, pricing change, onboarding update) rather than just watching curves drift without a hypothesis
- Give newer cohorts enough time to mature before drawing conclusions, since a cohort’s first month behavior does not always predict its eventual pattern
- Segment cohorts further by acquisition channel or first product purchased when the acquisition-month view alone doesn’t explain a divergence
Common Cohort Analysis Mistakes
A frequent mistake is drawing conclusions from a cohort that is too new to have matured, comparing a two-month-old cohort’s early numbers against a year-old cohort’s full trajectory and mistaking an early lead or lag for a lasting trend. Another common issue is defining cohorts inconsistently over time, for instance switching the acquisition event from “first purchase” to “signup date” partway through a reporting period, which breaks comparability between cohorts built before and after the change. Some teams also look only at retention percentage without pairing it with revenue per cohort, missing cases where a cohort retains at a similar rate but spends meaningfully less per order, a difference with real implications for lifetime value projections. A further pitfall is treating a single cohort dip as a permanent trend without checking for an external cause, such as a seasonal acquisition spike that brought in lower-intent customers who were never going to retain as well as a typical cohort regardless of any internal change. Finally, some brands build cohort tables but never connect them back to acquisition spend, missing the most direct use case: confirming whether a channel’s customers are worth what it costs to acquire them once their actual retention and spend pattern is known.