



Inventory Turnover
Inventory turnover is a ratio that measures how many times a business sells and replaces its stock over a given period, usually a year. It's calculated by dividing cost of goods sold by average inventory value, and it's one of the clearest indicators of how efficiently a merchant is managing working capital tied up in stock.
Definition of Inventory Turnover
Inventory turnover (also called the stock turnover ratio or inventory turns) measures how efficiently a business converts inventory into sales over a set period. It answers a simple operational question: how many times did we sell through our entire stock in the last year? A high ratio generally suggests inventory is moving quickly and capital isn’t sitting idle on warehouse shelves; a low ratio suggests stock is accumulating faster than it sells, tying up cash, storage space, and often risking markdowns or write-offs as products age or go out of season.
How Inventory Turnover Is Calculated
The standard formula is:
Inventory Turnover = Cost of Goods Sold (COGS) ÷ Average Inventory Value
Average inventory value is typically calculated as (beginning inventory + ending inventory) ÷ 2, smoothing out swings from a single snapshot date.
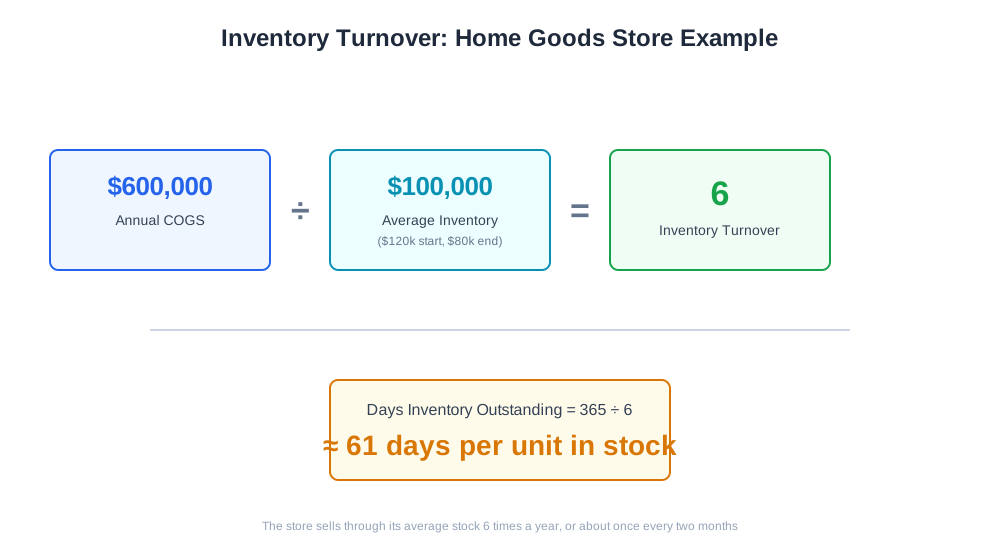
Worked example: a home goods store reports annual COGS of $600,000. Its inventory value was $120,000 at the start of the year and $80,000 at the end, giving an average of $100,000.
Inventory Turnover = $600,000 ÷ $100,000 = 6
That means the store sold through the equivalent of its entire average stock six times over the year, or roughly once every two months. Converting that into days is often more intuitive:
Days Inventory Outstanding = 365 ÷ Turnover Ratio = 365 ÷ 6 ≈ 61 days
So a typical unit sits in stock for about two months before it sells.

Ready to Monitor Your AI Visibility?
Track how AI chatbots mention your brand across ChatGPT, Perplexity, and other platforms.
Why Inventory Turnover Matters for E-commerce Brands
Inventory ties up real cash. Every dollar spent on stock that hasn’t sold yet is a dollar that isn’t available for marketing, new product development, or simply sitting in the bank earning interest. A merchant with a turnover ratio of 3 is effectively carrying twice as much idle capital, relative to sales, as one with a ratio of 6 — even if both businesses have identical revenue.
Turnover also has a strong relationship with markdown risk. Slow-moving inventory is more likely to need discounting to clear, especially in categories with seasonality, trend cycles, or shelf-life constraints. Tracking turnover at the SKU or category level, rather than only at the business level, is what actually makes the metric actionable: a strong overall ratio can hide a handful of severely overstocked SKUs dragging down cash flow while best-sellers stay lean.
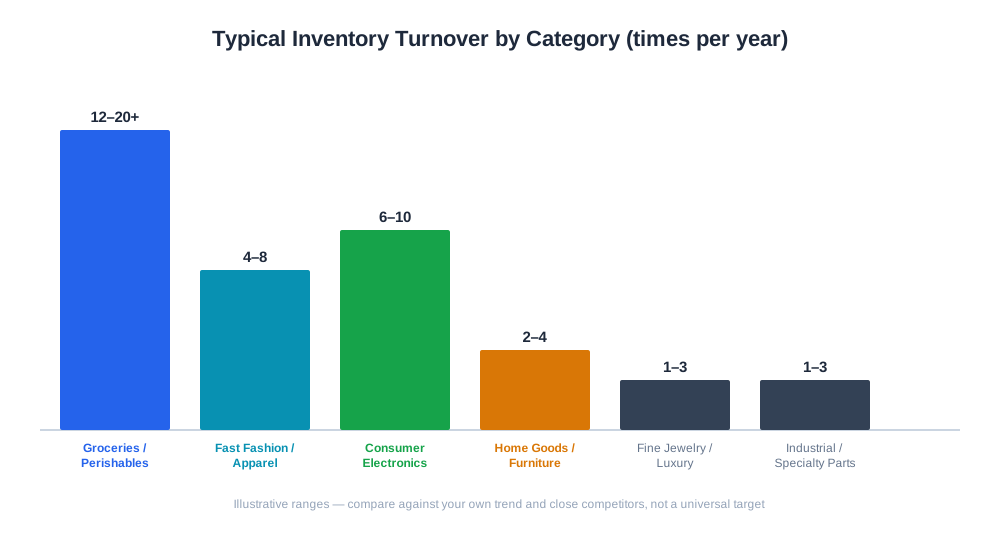
Inventory Turnover Benchmarks by Category
| Category | Typical Turnover Range (per year) | Notes |
|---|---|---|
| Groceries / perishables | 12–20+ | Short shelf life forces rapid cycling |
| Fast fashion / apparel | 4–8 | Trend-driven, seasonal markdown pressure |
| Consumer electronics | 6–10 | Fast depreciation, new model cycles |
| Home goods / furniture | 2–4 | High price point, longer consideration cycle |
| Fine jewelry / luxury | 1–3 | Low volume, high margin per unit |
| Industrial / specialty parts | 1–3 | Low demand predictability, safety stock heavy |
These ranges are illustrative starting points, not fixed targets — a merchant should compare its own historical trend and close competitors rather than chasing a generic industry number.
Stay Updated on AI Visibility Trends
Get the latest insights on AI mentions, brand monitoring, and optimization strategies.
Inventory Turnover and AI-Driven Commerce
Inventory turnover doesn’t have a direct AI-shopping-assistant angle the way stock availability does, but it’s the underlying discipline that keeps availability data accurate. A store with poor turnover discipline often has messy, out-of-date inventory feeds — the kind of thing that causes an AI shopping assistant like ChatGPT Shopping or Amazon Rufus to recommend a product that’s actually out of stock or discontinued, creating a bad experience that reflects on both the merchant and the platform recommending it.
More directly, AmICited’s e-commerce analytics tools give merchants visibility into product-level sales velocity, margin, and revenue trends — the same underlying data that feeds an inventory turnover calculation. Combining that with AmICited’s AI-visibility tracking lets a merchant see whether the products getting cited or recommended by AI assistants are also the ones moving fastest through inventory, which helps prioritize which SKUs deserve tighter stock discipline and which are safe to overstock slightly for demand spikes.
Best Practices for Inventory Turnover
- Calculate turnover at the SKU or category level, not just company-wide, to catch localized overstock problems
- Compare turnover trends over time rather than relying on a single snapshot, since seasonality distorts short windows
- Pair turnover with margin data — a fast-turning, low-margin SKU may generate less real profit than a slower, high-margin one
- Set reorder points based on actual sales velocity rather than round-number habits (“always order 500 units”)
- Use turnover data to plan markdown timing before slow SKUs become dead stock
- Review turnover alongside stockout frequency, since chasing a very high ratio can start causing lost sales
Common Inventory Turnover Mistakes
A common mistake is calculating turnover only at the company level and missing that a handful of chronically overstocked SKUs are dragging down an otherwise healthy average — the fix is breaking the ratio down by category or individual product. Another frequent issue is comparing a business’s turnover against a generic industry benchmark without accounting for category differences; a furniture retailer will never match a grocery brand’s turnover, and treating that as a problem leads to unnecessary understocking. Some merchants chase turnover improvements purely by discounting aggressively, which does move stock but can quietly erode margin faster than the cash-flow benefit is worth — turnover and profitability need to be reviewed together, not turnover alone. Seasonal businesses sometimes miscalculate average inventory by using only a single beginning and ending balance that happens to land during a low-stock period, producing an artificially inflated ratio; using more frequent snapshots (monthly rather than annual) gives a more honest average. Finally, businesses new to the metric sometimes chase turnover higher and higher without noticing rising stockout rates, trading working-capital efficiency for lost sales — the healthiest target balances both.