


Cost of Goods Sold (COGS)
Cost of Goods Sold (COGS) is the direct cost of producing or acquiring the products a business sells, including materials, manufacturing, and inbound freight. It excludes indirect costs like marketing, rent, or salaries, and is the figure subtracted from revenue to calculate gross profit. For e-commerce brands, accurate COGS tracking at the product level is the foundation of any pricing or margin decision.
Definition of Cost of Goods Sold (COGS)
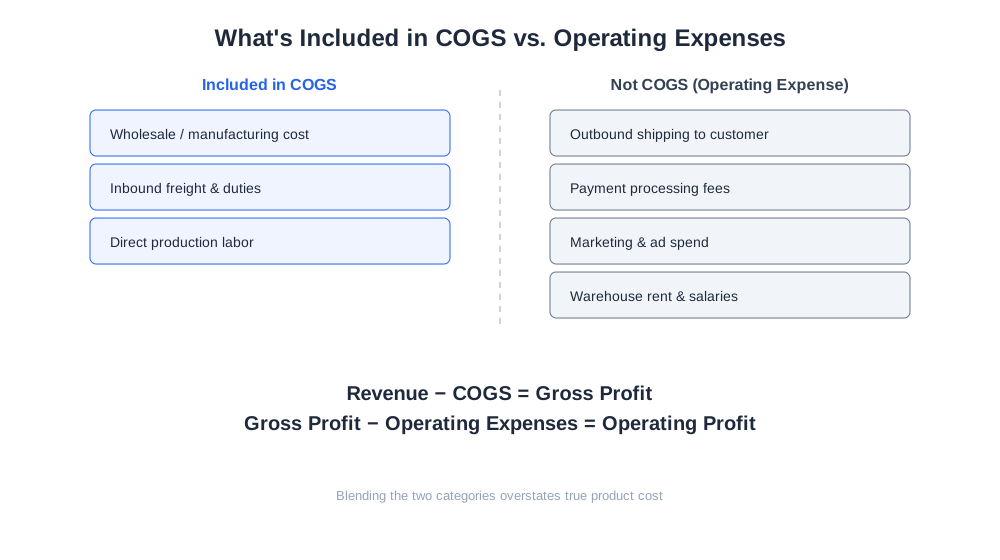
Cost of Goods Sold (COGS) is the total direct cost a business incurs to produce or acquire the products it sells during a given period. For a physical product business, this typically means the wholesale or manufacturing cost of the item plus any inbound freight, customs duties, and direct labor needed to get that product ready for sale. COGS sits directly below revenue on an income statement, and revenue minus COGS produces gross profit — the money left over before marketing, rent, salaries, software, and other operating expenses are paid. COGS is not the same as total operating costs, and confusing the two is one of the most common ways early-stage e-commerce founders misjudge how healthy their business actually is. A store can have strong revenue and still be unprofitable at the unit level if COGS as a percentage of price creeps too high, which is why COGS is tracked both in aggregate, for accounting and tax purposes, and per product, for pricing and merchandising decisions.
How COGS Is Calculated
The standard accounting formula for COGS over a period is:
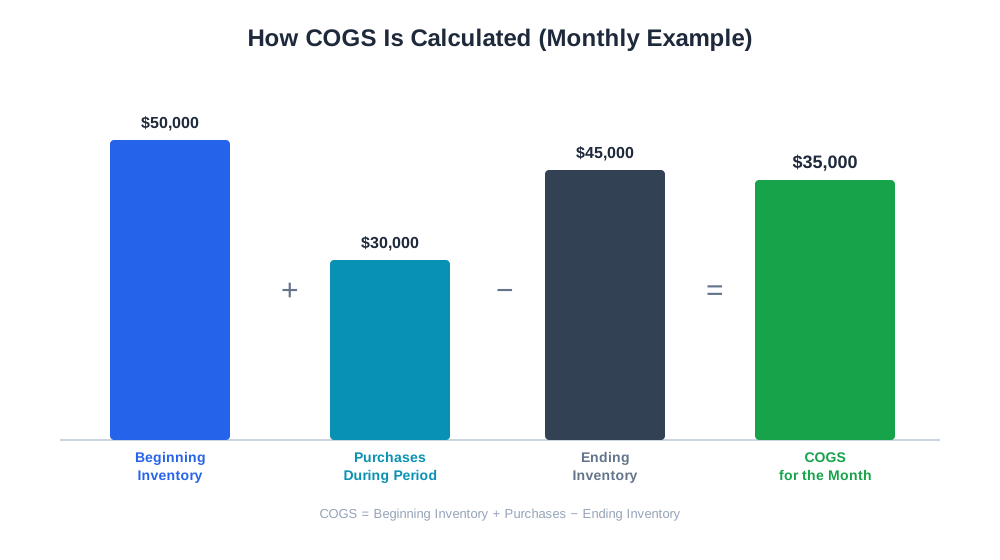
COGS = Beginning Inventory + Purchases During Period − Ending Inventory
This formula works at the whole-business level: it captures how much inventory value was actually consumed by sales, regardless of when it was purchased. For example, imagine a store starts the month with $50,000 of inventory on hand, purchases another $30,000 of stock during the month, and ends the month with $45,000 of inventory remaining. COGS for that month is $50,000 + $30,000 − $45,000 = $35,000.
At the product level, COGS is usually simpler to reason about: it’s the per-unit cost multiplied by units sold. If a product costs a brand $12 to source and land in the warehouse, and the store sells 500 units of it in a month, that product’s COGS contribution for the month is $6,000. Multiplying per-unit cost by units sold across every SKU and summing the result should reconcile closely with the beginning/ending inventory formula above — a useful sanity check when the numbers drift, which usually signals a costing error somewhere in the catalog.

Ready to Monitor Your AI Visibility?
Track how AI chatbots mention your brand across ChatGPT, Perplexity, and other platforms.
Why COGS Matters for E-commerce Brands
COGS is the single biggest lever most e-commerce brands have over profitability, because it usually represents the largest cost category on the income statement — larger than marketing, larger than fulfillment, larger than platform fees. Every pricing decision, supplier negotiation, and product-mix decision runs through COGS. A brand that doesn’t track COGS accurately at the SKU level can be systematically over-discounting its lowest-margin products, under-pricing new launches relative to true cost, or missing that a “hero” product by revenue is actually a marginal contributor once true landed cost is accounted for.
COGS also directly determines how much room a brand has for customer acquisition spend, discounting, and free-shipping thresholds. A product with 70% gross margin can absorb a much more aggressive promotional strategy than one with 30% margin, and brands that set promotional calendars without checking per-product COGS often run campaigns that generate revenue while destroying profit.
COGS vs. Related Cost Metrics
| Metric | What It Captures | Included in COGS? |
|---|---|---|
| Wholesale / manufacturing cost | Price paid to make or buy the product | Yes |
| Inbound freight and duties | Cost to ship inventory into the warehouse | Yes |
| Direct production labor | Labor tied directly to making the product | Yes |
| Outbound shipping to customer | Cost to deliver the sold order | No — fulfillment expense |
| Payment processing fees | Card network and gateway fees | No — operating expense |
| Marketing and ad spend | Cost to acquire the customer | No — operating expense |
| Warehouse rent and staff salaries | Overhead to run the business | No — operating expense |
Stay Updated on AI Visibility Trends
Get the latest insights on AI mentions, brand monitoring, and optimization strategies.
COGS and AI-Driven Commerce
As shopping increasingly routes through AI assistants like ChatGPT Shopping, Perplexity Shopping, and Amazon Rufus, brands are under new pressure to compete on price transparently, since these assistants often surface comparable products and prices side by side rather than relying on a single storefront’s framing. That makes accurate, real-time COGS visibility more important, not less — a brand that doesn’t know its true per-product cost has no reliable floor for how far it can drop price to stay competitive in an AI-surfaced comparison without selling at a loss.
This is where product-level cost data becomes an operational tool rather than a quarterly accounting exercise. AmICited’s eshop_get_operations and eshop_list_product_costs tools pull actual per-product purchase costs directly from a connected store, so a merchant can see live COGS by SKU alongside the revenue and traffic data already being tracked — rather than relying on a spreadsheet estimate that goes stale the moment a supplier changes pricing.
Best Practices for Tracking COGS
- Track cost at the SKU level, not as a single blended percentage across the whole catalog — blended margins hide individual loss-making products
- Update per-unit costs whenever a supplier price change, currency shift, or new freight rate takes effect, rather than on a fixed quarterly schedule
- Include inbound freight and duties in landed cost calculations, not just the invoice price from the supplier
- Reconcile SKU-level COGS totals against the beginning/ending inventory formula periodically to catch data entry errors
- Separate COGS from fulfillment and marketing costs cleanly in your accounting system so gross margin numbers stay meaningful
- Revisit COGS before launching any sitewide discount or promotional calendar, not after
Common COGS Mistakes
A common mistake is using a single average cost percentage across the entire catalog instead of tracking cost per SKU. This might show a healthy 40% gross margin overall while masking that a popular bundle or bestseller is actually selling near breakeven once its true landed cost is applied — the fix is moving to per-product cost tracking rather than a single blended assumption.
Another frequent issue is excluding inbound freight and duties from COGS, which understates true product cost, especially for brands importing from overseas suppliers where freight costs can swing significantly between shipments. When freight rates spike, a brand that only tracks the supplier invoice price will see gross margin appear stable on paper while it’s actually eroding in reality.
Some brands also let COGS data go stale after a supplier renegotiation or a factory switch, continuing to use last year’s cost figures in pricing decisions. This creates a gap between reported margin and actual margin that only surfaces when someone reconciles bank statements against the books, often after several months of mispriced promotions.
Finally, treating outbound shipping or payment processing fees as part of COGS, rather than as separate operating expenses, inflates the perceived cost of goods and can lead a brand to overprice products to compensate for costs that belong in a different part of the income statement entirely.