


Purchase Frequency
Purchase frequency measures how often an average customer buys from a store within a given period, typically expressed as the number of orders per customer per year. It's a key input into customer lifetime value and a direct signal of how habitual repeat buying is for a given product category. Rising purchase frequency generally means existing customers are worth more without any change in acquisition spend.
Definition of Purchase Frequency
Purchase frequency measures how often the average customer buys from a store within a defined period, typically expressed as orders per customer per year. It’s a compact way of describing how habitual repeat buying is for a given business, and it varies enormously by category: a consumables brand naturally supports a much higher purchase frequency than a brand selling infrequently replaced durable goods, so the metric is far more useful compared against a store’s own history than against an unrelated category’s benchmark.
How Purchase Frequency Is Calculated
The formula is straightforward:
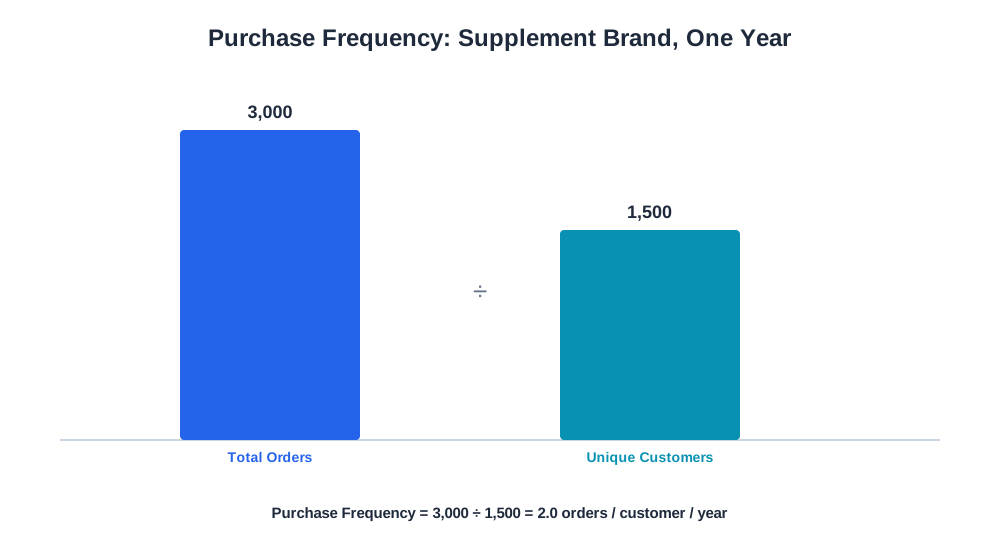
Purchase Frequency = Total Orders in Period ÷ Unique Customers in Period
For example, a supplement brand processes 3,000 orders in a year from 1,500 unique customers. Purchase frequency for that year is 3,000 ÷ 1,500 = 2.0, meaning the average customer ordered twice.

Ready to Monitor Your AI Visibility?
Track how AI chatbots mention your brand across ChatGPT, Perplexity, and other platforms.
Why Purchase Frequency Matters for E-commerce Brands
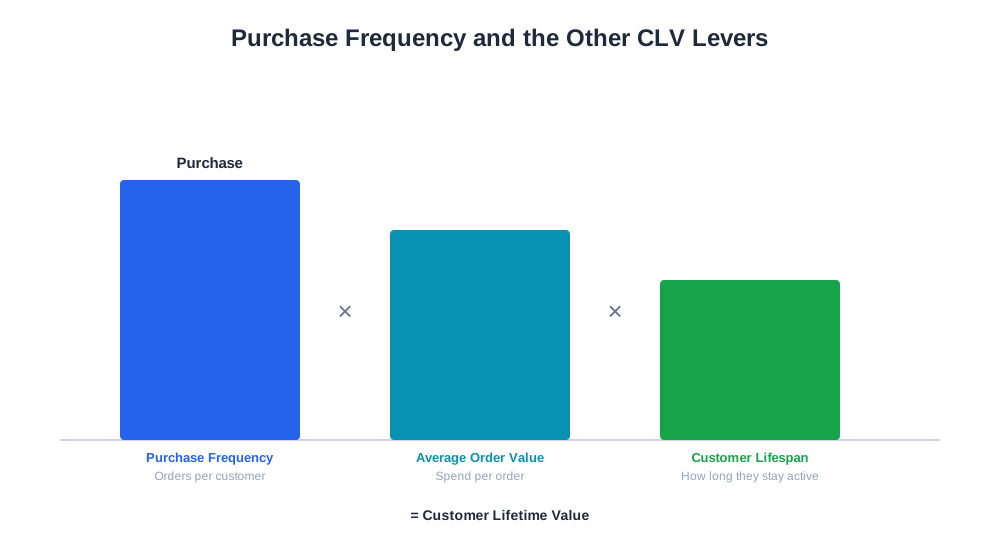
Purchase frequency is one of the three core inputs into customer lifetime value, alongside average order value and customer lifespan. Because it multiplies directly into lifetime value, even a modest increase in how often existing customers reorder can meaningfully raise how much each customer is worth, without spending anything additional on acquisition. This makes purchase frequency one of the more efficient levers a brand can pull compared to acquiring entirely new customers.
It’s also a useful diagnostic for product-market fit within a category. A consumable product with unexpectedly low purchase frequency relative to its natural usage cycle can signal a problem — perhaps the product isn’t being used as expected, or customers are finding it elsewhere once they’ve tried it.
Purchase Frequency vs. Related Metrics
| Metric | What It Measures |
|---|---|
| Purchase Frequency | How many times an average customer orders in a period |
| Repeat Purchase Rate | Whether a customer ever orders a second time at all |
| Returning Customer Rate | What share of current orders come from past customers |
| Average Order Value | How much a customer spends per order |
These metrics interact directly: a store can raise customer lifetime value either by increasing purchase frequency, increasing average order value, or both, and comparing the two levers side by side often reveals which one has more realistic room to improve for a given catalog and customer base.
Stay Updated on AI Visibility Trends
Get the latest insights on AI mentions, brand monitoring, and optimization strategies.
Purchase Frequency and AI-Driven Commerce
As AI shopping assistants like ChatGPT Shopping and Perplexity Shopping become more involved in routine reorder decisions, purchase frequency data becomes useful for timing outreach — knowing that a typical customer reorders roughly every 45 days, for instance, lets a brand send a reminder before an AI assistant has a chance to surface a competing product at that decision point instead.
AmICited’s eshop_get_replenishment and eshop_get_repeat tools track how often customers actually come back to reorder from a connected store, giving merchants real purchase cycle data to base reminders and loyalty campaigns on, rather than an assumed cadence.
Best Practices for Purchase Frequency
- Calculate purchase frequency by product category or customer segment, not just store-wide, since blended figures can hide meaningful variation
- Time replenishment reminders to the actual observed purchase cycle for a product, not a generic interval
- Test loyalty or subscription incentives specifically aimed at increasing frequency among already-retained customers
- Track purchase frequency trends over time to catch early signs of a category or customer segment falling out of habit
Common Purchase Frequency Mistakes
A common mistake is calculating purchase frequency store-wide and missing that it varies significantly by product category, masking a specific category quietly underperforming its natural repurchase cycle. Segmenting the calculation by category surfaces problems a blended number would hide.
Another issue is sending replenishment reminders on a generic schedule rather than one grounded in observed customer behavior, which either arrives too early to be useful or too late after the customer has already reordered elsewhere.