


Market Basket Analysis
Market basket analysis is a data mining technique that examines which products customers tend to purchase together, revealing patterns like 'customers who buy X also buy Y.' Retailers use it to inform product placement, bundling, cross-sell recommendations, and promotional strategy based on real co-purchase behavior rather than guesswork.
Definition of Market Basket Analysis
Market basket analysis is a data mining technique that identifies patterns in what customers purchase together within the same transaction. The name comes from its original retail application — literally analyzing the contents of a shopping basket to see which items tend to appear side by side. The technique produces association rules in the form “if a customer buys item A, they are also likely to buy item B,” and it does this by mining historical order data rather than relying on assumptions or category groupings that a merchandiser thinks make sense. In e-commerce specifically, market basket analysis has become a foundational input to product recommendation engines, bundle design, and promotional planning, because it replaces guesswork about which products complement each other with evidence drawn directly from actual customer behavior.
How Market Basket Analysis Works
Market basket analysis relies on three core statistical measures. Support measures how often a combination of items appears across all transactions — if 500 out of 10,000 orders include both a phone case and a screen protector, the support for that pair is 5 percent. Confidence measures the conditional likelihood that a customer who buys item A also buys item B — if 60 percent of the people who bought the phone case also bought the screen protector, confidence for that rule is 60 percent. Lift compares that confidence to what would be expected if the two purchases were unrelated; a lift value above 1 means the pairing happens more often than random chance would predict, while a lift near 1 suggests the items are unrelated and just happen to be popular independently.
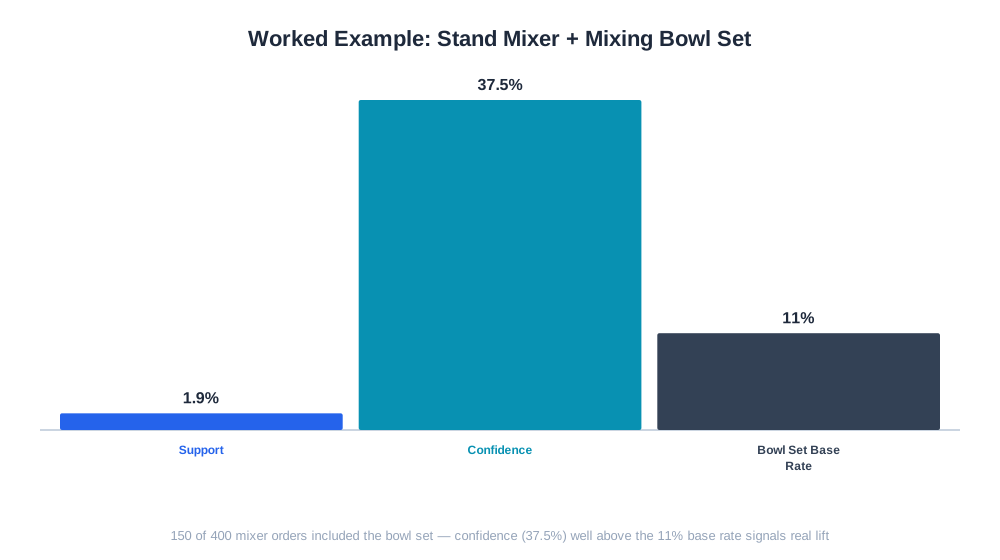
A practical example: suppose a home goods store sells 8,000 orders in a quarter. A stand mixer appears in 400 of them, and a mixing bowl set appears in 900 of them. If 150 orders contain both, the support for that pair is about 1.9 percent. The confidence that a stand mixer purchase includes a mixing bowl set is 150 divided by 400, or 37.5 percent — compared to the mixing bowl set’s overall purchase rate of about 11 percent, giving a lift well above 1 and confirming a genuine association worth acting on with a bundle or a “frequently bought together” placement.

Ready to Monitor Your AI Visibility?
Track how AI chatbots mention your brand across ChatGPT, Perplexity, and other platforms.
Why Market Basket Analysis Matters for E-commerce Brands
Without market basket analysis, merchandising decisions about bundles, cross-sells, and product placement default to intuition, which frequently misses non-obvious pairings that don’t fit an obvious category relationship — a camping store might discover that customers buying tents also disproportionately buy a specific brand of insect repellent, a connection a category manager would be unlikely to guess without the data.
Acting on real associations tends to lift average order value more reliably than generic “you might also like” widgets built from category similarity alone, because the recommendation reflects actual buying behavior rather than a taxonomy match. Market basket analysis also helps avoid wasted promotional spend: discounting two products that are already almost always bought together doesn’t grow basket size, it just reduces margin on a purchase that would have happened anyway, while discounting a pairing with high lift but currently low support can convert an untapped association into new incremental revenue.
Market Basket Analysis Metrics at a Glance
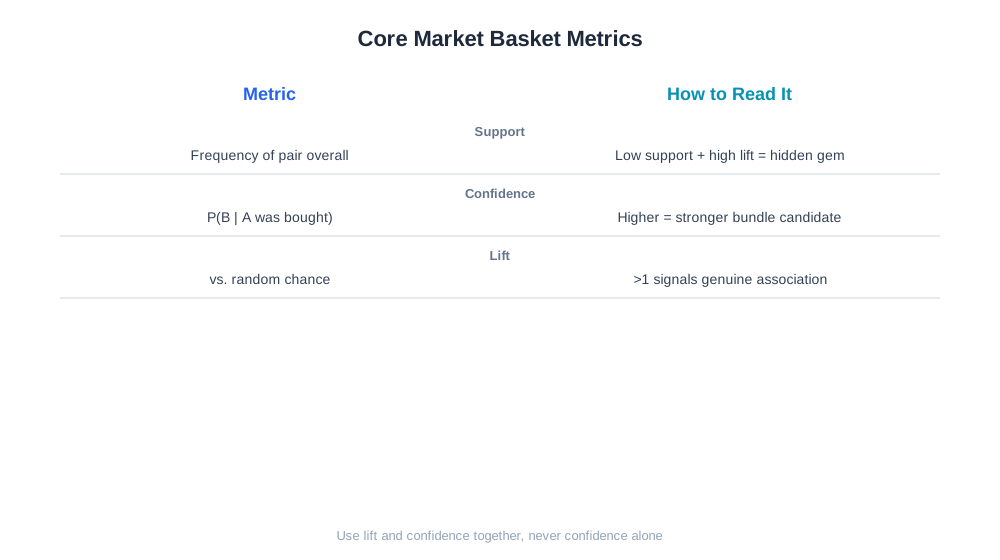
| Metric | What It Measures | How to Read It |
|---|---|---|
| Support | How often the item combination appears overall | Low support with high lift can still be a hidden gem worth testing |
| Confidence | Likelihood of buying B given A was bought | Higher confidence means a stronger candidate for “frequently bought together” |
| Lift | How much more likely the pairing is than chance | Lift above 1 signals a genuine association, not coincidence |
| Conviction | How dependent B’s absence is on A’s absence | Useful for identifying near-mandatory add-on purchases |
Stay Updated on AI Visibility Trends
Get the latest insights on AI mentions, brand monitoring, and optimization strategies.
Market Basket Analysis in AI-Driven Commerce
As AI shopping assistants like ChatGPT Shopping and Perplexity Shopping increasingly generate multi-item purchase suggestions in response to a single query, the underlying logic of market basket analysis is being applied at a new layer: an AI assistant recommending “a tent, a sleeping bag, and insect repellent” for a camping trip query is effectively performing a real-time version of the same association-rule reasoning that retailers have used on their own order data for decades. Brands that understand their own strongest product associations are better positioned to structure product listings, bundles, and content so that AI systems surface the right combinations rather than an arbitrary or incomplete set. On the operational side, AmICited’s eshop_get_product_bundles tool is a direct implementation of market basket analysis against a store’s own order history — it processes transaction data to surface statistically meaningful product pairs and groups, so a merchant can see which bundles are backed by real co-purchase evidence rather than a hunch, and can then act on that signal both in on-site merchandising and in how products are described for AI-driven discovery.
Best Practices for Market Basket Analysis
- Set a minimum support threshold appropriate to order volume; a store with thousands of daily orders can look at rare pairings, while a smaller store should focus on higher-support relationships to avoid noise.
- Combine lift with confidence rather than relying on either alone — a high-confidence rule with lift near 1 may just reflect two generally popular items, not a real relationship.
- Re-run the analysis periodically, since product assortments and customer behavior shift with seasonality, new launches, and discontinued SKUs.
- Segment the analysis by customer type where volume allows, since first-time buyers and repeat customers often show different co-purchase patterns.
- Translate findings into concrete actions — a specific bundle, a specific cross-sell placement — rather than leaving the analysis as a report nobody acts on.
Common Market Basket Analysis Mistakes
A frequent mistake is treating support, confidence, and lift as interchangeable, when each answers a different question; relying on confidence alone can surface pairs that are simply both popular items rather than genuinely associated, leading to bundles that don’t actually move average order value. Another common problem is running the analysis on too small a data sample, particularly for stores with limited order volume, which produces statistically unstable associations that look strong one month and vanish the next — a rule built on ten orders is far less reliable than one built on a thousand. Some merchants also apply findings too literally at the SKU level when the underlying pattern is really at the category level, missing broader bundling opportunities because they’re looking for an exact repeat pairing rather than a generalizable relationship. It’s also common to ignore seasonality: a pairing that looked strong during a holiday period may not hold the rest of the year, and treating it as a permanent bundle can lead to lower-than-expected attach rates outside that window. Finally, many stores run the analysis once and never revisit it, missing new associations that emerge as the catalog changes, which means the bundling and cross-sell logic gradually drifts out of sync with actual current customer behavior.