


Organic and Paid Page Analysis
AmICited plots organic vs paid traffic for every landing page, so you can tell in one look whether a page’s ad spend is adding real coverage or just buying clicks it would earn anyway.
Measure Organic and Paid Coverage
Start with pages carrying both organic traffic and paid spend, then weigh landing page performance to decide whether the ad is worth the budget. Compare periods to see whether a page changed before you touch its budget or content — and remember paid figures only cover imports made since landing-page data was added.
- Ten columns, one row per page — organic impressions and clicks beside paid impressions, paid clicks, cost, average cost-per-click, ad spend avoided, organic CTR and average position.
- Ad spend avoided, defined precisely — organic clicks on the page multiplied by the CPC actually paid for that same page, calculated per currency — an estimate of budget the page’s organic presence is already saving, not revenue.
- Read in native currency — figures are never converted or summed across ad accounts, so nothing gets silently blended.
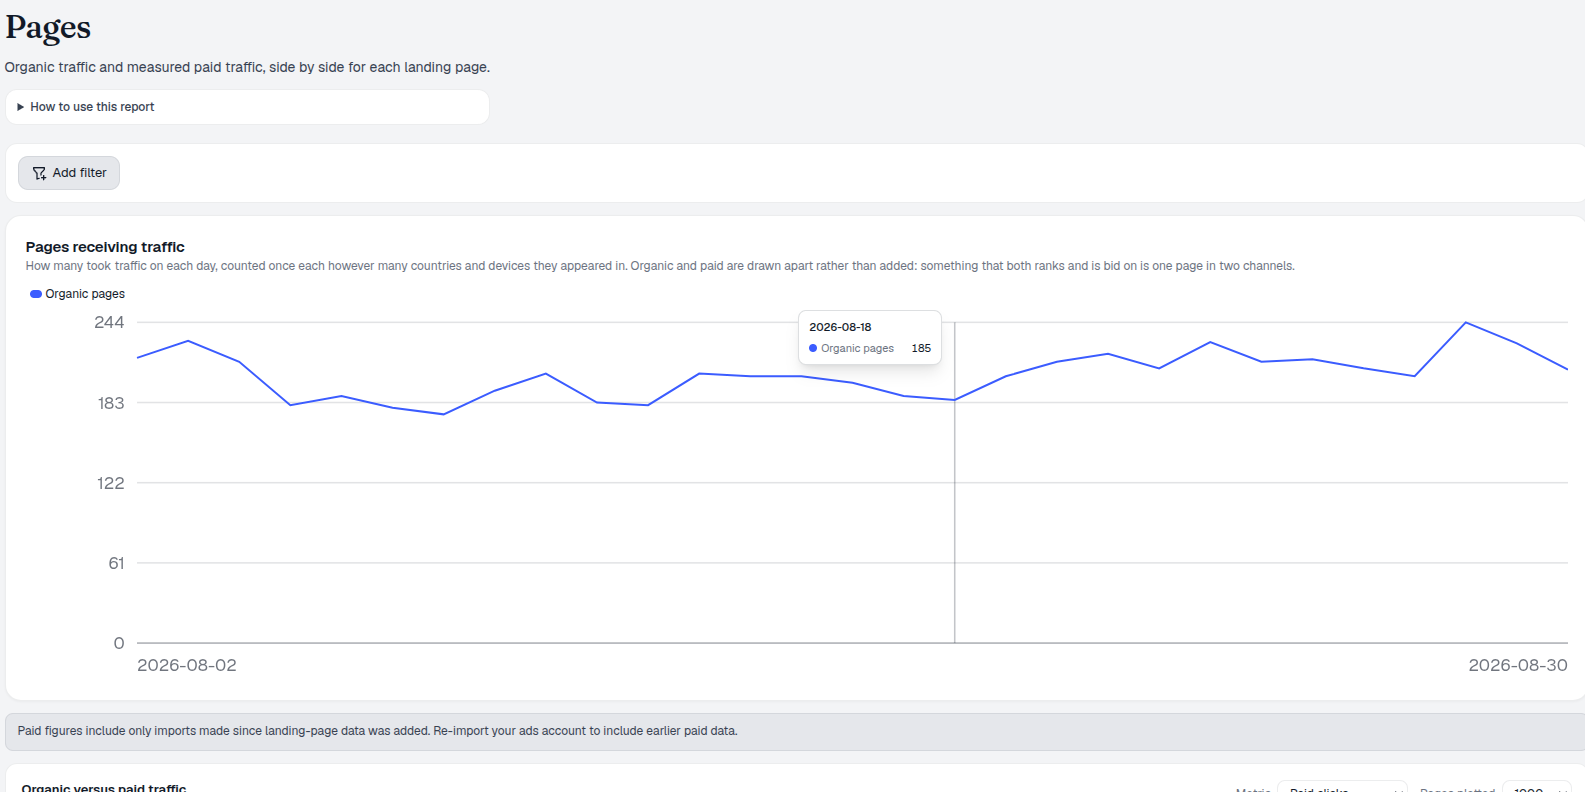
- Pages receiving traffic, charted daily — organic and paid pages counted separately per day, so a spike or a drop in reach is visible before you open the table; a page active in both channels counts once in each line, never twice.
- Compare periods — turn on Compare and set an earlier window to see whether a page’s numbers moved before you change anything.
- Re-import when needed — an older ads account import with no landing-page data just needs a fresh sync to fill the gap, and the report tells you plainly when that’s why paid columns read empty rather than zero.
- Drill from page to query — click a URL to see the individual queries earning it traffic, without leaving the report.
Organic and Paid Page Metrics
Each row is one landing page with ten numbers: organic impressions and clicks, paid impressions and clicks, cost, average cost-per-click, ad spend avoided, organic click-through rate and average organic position. Ad spend avoided is the tell — it estimates what the paid clicks on a page would have cost if bought at that page’s own average CPC, which is what you’re actually protecting (or wasting) by running the ad at all. Above the table, Pages receiving traffic counts organic and paid pages separately per day, so a reach change is visible before you open a single row.
- Organic impressions / clicks — the unpaid baseline for the page, from your connected search engines.
- Paid impressions / clicks / cost / avg. CPC — the same page’s paid performance, from your connected ads accounts.
- Ad spend avoided — organic clicks valued at the page’s own average CPC — the budget the page’s organic presence alone is already saving you.
- Organic CTR and average position — the two numbers that explain why organic volume is high or low in the first place.
Find Missing Organic Landing Pages
If a page carries heavy paid spend and zero organic presence, the term behind it usually belongs in Paid-Proven Gaps — proof of demand your ads already paid to establish.
- Sorted by spend to date — write the page for the term costing you the most first.
- Conversions over clicks — proven intent beats raw volume.
- Cut the bid once it ranks — stop paying twice for the same click.
Compare Page Demand and Spend
Organic clicks sit on the horizontal axis, and you choose what the vertical axis measures: paid clicks, paid impressions, or spend in one selected currency. Both axes use square-root scaling, so long-tail pages stay visible instead of collapsing against the origin under a handful of huge earners. Every bubble is one page, sized by its total organic plus paid clicks within a floor and ceiling radius, plotted up to 100, 500, 1,000, 2,500 or 5,000 pages at a time, fetched in descending organic-click order so the pages worth a decision load first.
- Square-root scale, both axes — keeps the long tail readable without letting your biggest pages crush everything else into a corner.
- Bubble size is total clicks — organic plus paid, bounded by a minimum and maximum radius so no single page is invisible or overwhelming.
- Choose the vertical axis — paid clicks, paid impressions, or spend in one currency; horizontal is always organic clicks.
- Plot up to 5,000 pages — 100, 500, 1,000, 2,500 or 5,000, always fetched by descending organic clicks.
pages plotted at once, by organic clicks
The organic-versus-paid scatter shows your top 1,000 pages by organic clicks, so the pages actually worth a decision surface first.
See Directory ViewAnalyze Organic and Paid Pages
Impressions, clicks, cost and ad spend avoided for every landing page — so you know exactly where paid is adding coverage and where it isn’t.
Ready to see which pages you’re paying for twice?
Free check · 7-day trial · card required