



AI Overviews now appear on 61.43% of US Google results pages, up from 5.93% two years earlier. That’s the headline of DataForSEO’s Search Insider 2026, which checked the same 20-million-keyword panel every month from September 2024 to August 2026.
The rest of the results page changed with it. Featured snippets almost disappeared, video results doubled and forum boxes lost two-thirds of their space. If you’ve seen other estimates, from 39% to 88%, most of them aren’t wrong. They measure different things, and this post explains which number fits which question.
It’s part of our series on the Search Insider 2026 findings.
Key Takeaways
- AI Overviews appeared on 61.43% of US Google results pages in August 2026, up from 5.93% in September 2024, in DataForSEO’s 20M-keyword monthly panel.
- AI Overview presence doubled in a year, from 30.70% in August 2025 to 61.43% in August 2026. Google isn’t rolling them back.
- Featured snippets fell from 8.96% to 0.44% of results pages over the same 24 months, and Discussions and forums fell from 21.13% to 7.42%.
- Video results doubled from 9.67% to 19.98%, and local packs rose from 19.98% to 25.99%.
- Published AI Overview rates range from about 39% to 88% because some studies count real searches, some count keywords and some count only commercial queries.
What the data shows
AI Overviews went from a rare feature to the default on Google in two years. In DataForSEO’s monthly panel of 20 million US keywords, the share of results pages with an AI Overview rose from 5.93% in September 2024 to 61.43% in August 2026. Over the same window, AI Overviews grew faster than any other SERP feature the report tracked.
The growth came in steps, not a straight line. AI Overview presence sat below 10% until February 2025, jumped to 14.67% in March 2025 and passed 30% in June 2025. It reached 43.76% in October 2025, then held between 41.81% and 45.00% for seven months.
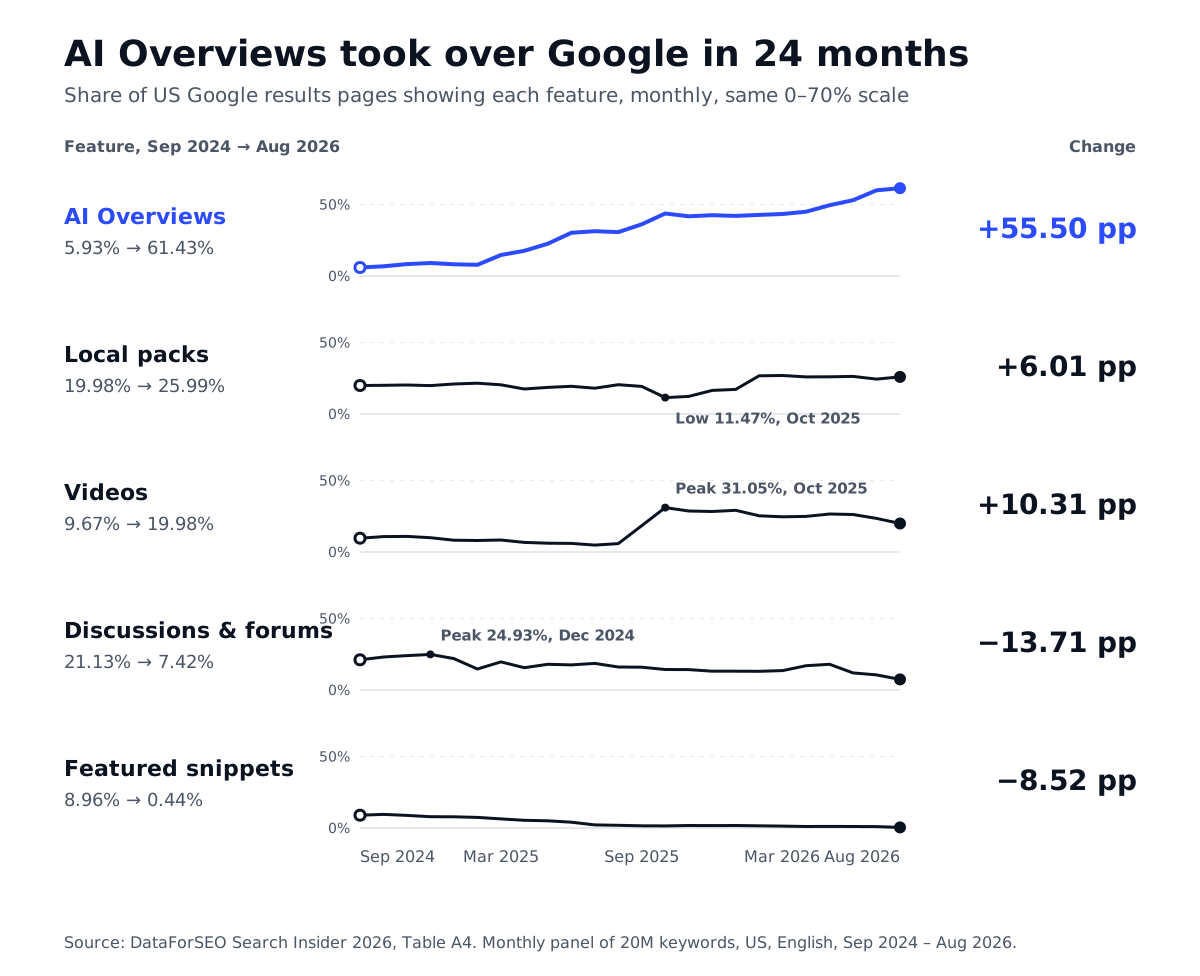
The second step came in 2026. AI Overviews rose from 45.00% in April to 49.57% in May, 53.08% in June, 60.02% in July and 61.43% in August. Four months added more than 16 percentage points.

Ready to Monitor Your AI Visibility?
Track how AI chatbots mention your brand across ChatGPT, Perplexity, and other platforms.
Is Google rolling them back?
Google isn’t rolling AI Overviews back. In 24 months of DataForSEO data, AI Overview presence fell month over month only five times, and the largest drop was 1.95 percentage points (43.76% in October 2025 to 41.81% in November). Every dip was followed by a new high within six months.
The year-over-year comparison is the clearest answer to “2026 vs 2025”. In August 2025, 30.70% of results pages in the panel had an AI Overview. In August 2026, 61.43% did. That’s double in twelve months.
Rollback stories usually come from single queries or single days. AI Overviews do change from search to search, and a query that showed one yesterday may not today. Across millions of keywords, though, the direction is one way.
What AI Overviews replaced
AI Overviews didn’t just add a box to the page. Other SERP features gave up space as they grew. Featured snippets and Discussions and forums lost the most, while videos and local packs gained. The table shows each feature every quarter, from DataForSEO’s Table A4.
| Month | AI Overviews | Local packs | Videos | Discussions & forums | Featured snippets |
|---|---|---|---|---|---|
| Sep 2024 | 5.93% | 19.98% | 9.67% | 21.13% | 8.96% |
| Dec 2024 | 9.09% | 19.89% | 10.02% | 24.93% | 7.92% |
| Mar 2025 | 14.67% | 20.41% | 8.40% | 19.64% | 6.39% |
| Jun 2025 | 30.27% | 19.40% | 6.01% | 17.56% | 4.03% |
| Sep 2025 | 36.19% | 19.32% | 18.38% | 15.96% | 1.52% |
| Dec 2025 | 42.57% | 16.54% | 28.35% | 13.13% | 1.70% |
| Mar 2026 | 43.38% | 26.94% | 24.65% | 13.58% | 1.32% |
| Jun 2026 | 53.08% | 26.34% | 26.27% | 11.95% | 1.06% |
| Aug 2026 | 61.43% | 25.99% | 19.98% | 7.42% | 0.44% |
Featured snippets fell from 8.96% to 0.44%, so a page that used to win “position zero” now usually competes for a citation inside the AI Overview instead. Our guide to AI Overviews and featured snippets covers how the two formats differ.
Discussions and forums, the box that shows forum threads from sites like Reddit and Quora, fell from 21.13% to 7.42%. That’s the SERP feature, not Reddit’s organic rankings, which held steady at about a third of top-10 results (32.15% in Q3 2026) in the same report.
Videos doubled overall, with a sharp jump from 5.85% in August 2025 to 31.05% in October 2025 before easing to 19.98%. Local packs dipped to 11.47% in October 2025 and recovered to about 26% from February 2026. The report doesn’t explain either swing. Video matters inside AI Overviews too: YouTube was the most-cited domain in our AI Overviews tracking, linked in 4.8% of 2,010 responses (1,905 prompts, June 24 to July 23, 2026).
Stay Updated on AI Visibility Trends
Get the latest insights on AI mentions, brand monitoring, and optimization strategies.
Why other studies disagree
Published AI Overview rates range from about 39% to 88% because each study counts something different. Share of real searches comes in lowest, likely because high-volume searches trigger AI Overviews less often. A broad keyword panel sits in the middle. Small, hand-picked tracking sets and commercial-only panels come in highest.
| Source | AI Overview rate | What it counts | When |
|---|---|---|---|
| Comscore, reported by Search Engine Land | 39.4% | Real US desktop searches | June 2026 |
| Third-party traffic data, via TechCrunch | 43% | Google searches by real users, up from 15% a year earlier | Reported July 2026 |
| DataForSEO Search Insider 2026 | 61.43% | 20M-keyword US panel, each keyword counted once | August 2026 |
| seoClarity, via Search Engine Roundtable | Over 62% (55% to 84% by industry) | Tracked queries | Reported October 2026 |
| Advanced Web Ranking, via Xponent21 | 80.56% non-personalized, 85.55% personalized | 8,000 tracked US keywords | October 26, 2026 |
| SE Ranking, via Search Engine Roundtable | 82.5% | US brand searches only | Reported October 2026 |
Share of searches vs share of keywords. Comscore and similar traffic panels weight every query by how often real people run it. Head terms like brand names and site lookups make up a big share of searches and trigger AI Overviews less often. DataForSEO’s own quarterly panel shows the pattern: in Q3 2026, navigational searches got an AI Overview 34.03% of the time, against 70.44% for informational ones. Keywords with 601+ monthly searches triggered one 48.62% of the time, against 58.59% for 201–300.
Broad panels vs chosen sets. A tracker that follows 8,000 keywords picks them for a reason, and those lists tend to lean toward questions and research queries, where AI Overviews are common. DataForSEO’s 20M-keyword panel covers far more of the long tail.
Commercial panels. AI engines often quote an 88% figure attributed to Semrush for a small panel of commercial-modifier keywords, like “best X for Y”. Semrush reports it for 400 such keywords on US desktop in August 2026. It describes one query type, not Google as a whole.
Personalization, device and date. Advanced Web Ranking saw a 5-point gap between personalized and non-personalized results on the same keywords. Comscore’s figure is desktop only. And because the rate rose 16 points between April and August 2026, a study from spring 2026 will read low today.
Rates also differ by intent and industry. Informational searches led at 70.44% in Q3 2026, followed by commercial (51.35%), navigational (34.03%) and transactional (28.64%), all up from Q4 2025. Our post on AI Overviews in commercial searches covers that split.
How to measure your keywords
The only AI Overview rate that matters for your plan is the one for your own keywords. Market-wide numbers set expectations, but your mix of intents, volumes and industries decides how many of your queries show an AI Overview. Measure it per keyword or prompt, from a fixed country, and repeat it over time.
Start with Search Console. Its generative AI report shows impressions of your pages in Google’s AI features, but no clicks, queries or competitors. Our guide to Search Console’s AI performance report explains what it can and can’t tell you.
Then run the queries that matter through a tracker. Record whether an AI Overview appeared, which pages it cited and whether yours was one of them. Our step-by-step guide to tracking Google AI Overviews covers prompt selection, engines and cadence.
What brands should do now
- Measure your own AI Overview rate. Track your priority queries in AI Overviews and AI Mode with an AI rank tracker, and note which ones show an AI answer. Don’t plan on a market average.
- Re-forecast traffic for queries with an AI Overview. Clicks behave differently on those pages. Our posts on organic CTR by position and where clicks go when an AI Overview appears give the benchmarks, and the CTR Gap report compares each query against your own click curve.
- Move featured snippet work to citation work. With snippets on 0.44% of results pages, check which pages AI Overviews cite for your queries instead. Source & Citation Intelligence lists them per engine.
- Find pages that rank but aren’t cited. The Citation-Ranking Gap report shows queries where you rank well and AI answers cite someone else.
- Plan for video and local. Videos appear on 19.98% of results pages and local packs on 25.99%. If your category shows either, they’re space you can still win outside the AI answer.
The takeaway
AI Overviews appear on six in ten US Google results pages, and the trend is still up. The exact percentage depends on what you count, so use share-of-searches figures to size exposure and keyword-level tracking to plan your own work. Either way, the results page your SEO plan was built for now has an AI answer on top, and featured snippets are nearly gone.
 LinkedIn