



Organic CTR for the top Google result on desktop fell from 17.83% to 7.43% in a year. On mobile, position 1 dropped less, from 25.17% to 20.80%. Those figures come from DataForSEO’s Search Insider 2026, which tracked anonymized organic search performance data from more than 2,000 websites (US searches) between September 2025 and August 2026.
Most CTR by position tables give one number per position and no trend. This one has a year-over-year change and a desktop versus mobile split, and the two tell different stories. Below is the full table, when the drops happened, why other benchmarks disagree and how to compare your own numbers.
It’s part of our series on the Search Insider 2026 findings.
Key Takeaways
- Desktop CTR for position 1 fell from 17.83% to 7.43% between September 2025 and August 2026, a drop of 10.41 percentage points.
- Desktop position 2 fell even further, from 15.27% to 3.07% (−12.20 points), most of it in a single month.
- Mobile held up better: position 1 fell from 25.17% to 20.80% (−4.37 points), and position 2 rose from 7.99% to 8.52%.
- In August 2026, mobile position 2 (8.52%) earned a higher CTR than desktop position 1 (7.43%).
- Published position 1 benchmarks range from 7.1% to about 28% because they differ in device mix, date and AI Overview presence.
What the data shows
Desktop organic CTR fell at every position between September 2025 and August 2026, and the biggest drops were at the top. Position 1 lost 10.41 percentage points and position 2 lost 12.20. Mobile CTR fell less, and mobile position 2 went up. The data covers 2K+ websites (US searches) with at least 1,000 impressions a month.
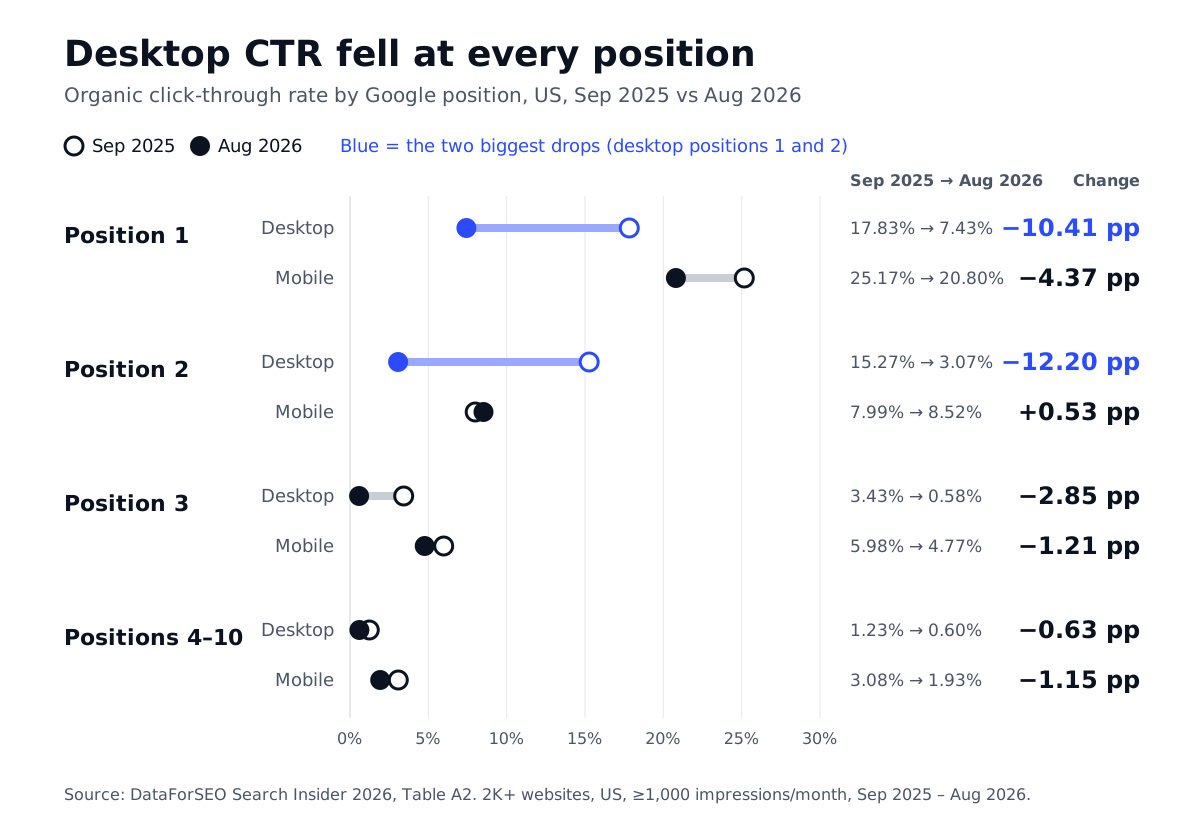
Here is the full organic CTR breakdown by position, from the report’s body text and Table A2:
| Position | Device | Sep 2025 | Aug 2026 | Change |
|---|---|---|---|---|
| 1 | Desktop | 17.83% | 7.43% | −10.41 pp |
| 1 | Mobile | 25.17% | 20.80% | −4.37 pp |
| 2 | Desktop | 15.27% | 3.07% | −12.20 pp |
| 2 | Mobile | 7.99% | 8.52% | +0.53 pp |
| 3 | Desktop | 3.43% | 0.58% | −2.85 pp |
| 3 | Mobile | 5.98% | 4.77% | −1.21 pp |
| 4–10 | Desktop | 1.23% | 0.60% | −0.63 pp |
| 4–10 | Mobile | 3.08% | 1.93% | −1.15 pp |
A desktop result in position 3 now gets 0.58% of its impressions as clicks, about one click per 170 impressions. Positions 4–10 on desktop average 0.60%, so on desktop there’s little difference between third place and tenth.

Ready to Monitor Your AI Visibility?
Track how AI chatbots mention your brand across ChatGPT, Perplexity, and other platforms.
When the drop happened
The desktop decline came in two steps, not as a slow slide. Desktop position 2 fell from 15.27% to 5.37% between September and October 2025. Desktop position 1 held between 13.33% and 18.24% until February 2026, then fell from 15.18% to 7.94% in March and stayed between 7.21% and 9.27% through August.
Anonymized organic search performance data from 2K+ websites, US searches, at least 1,000 impressions per month.
The September 2025 starting point matters for position 2. Desktop position 2 never came close to 15.27% again: from October 2025 to August 2026 it ranged from 0.95% to 6.76%. So the 12.20-point drop is real, but most of it is one month’s change from an unusually high start.
DataForSEO is clear that its data doesn’t establish the cause. AI Overviews, changes to the results page layout and shifts in user behaviour could each play a part. One detail argues against a simple story: in the report’s separate SERP panel, AI Overview presence barely moved between February and March 2026 (42.79% to 43.38%), the month desktop position 1 halved. Our post on how often AI Overviews appear has the full monthly series.
Desktop versus mobile
Mobile organic CTR is now far higher than desktop at every position. In August 2026, a mobile result in position 1 got 20.80% of impressions as clicks, 2.8 times the desktop rate of 7.43%. Mobile position 2, at 8.52%, out-clicked desktop position 1. A year earlier, desktop still led at position 2.
Mobile wasn’t flat all year, though. Mobile position 1 dipped to 12.96% in February 2026, then recovered to between 20.60% and 23.48% from May to August. Mobile position 2 followed a similar path, from 4.86% in April back to 8.52% in August.
The practical point is that a blended CTR hides two different trends. If most of your traffic comes from desktop, your top rankings likely earn far fewer clicks than they did in 2025. If most of it is mobile, the change is smaller. Splitting by device is the first thing to do with your own data.
Stay Updated on AI Visibility Trends
Get the latest insights on AI mentions, brand monitoring, and optimization strategies.
Why other benchmarks differ
Published CTR for position 1 ranges from about 7% to 28%, and each figure answers a different question. Blended studies mix desktop and mobile. Some split results with and without an AI Overview. Older studies predate AI Overviews entirely. DataForSEO’s is the only one here with a year-over-year trend and a device split.
| Study | Position 1 CTR | What it measures | Period |
|---|---|---|---|
| DataForSEO Search Insider 2026 | 7.43% desktop, 20.80% mobile | Organic search performance data, 2K+ sites, US searches | August 2026 |
| First Page Sage | 7.1% blended; 3.6% with an AI answer, 22.6% without | 1,184 domains, 3.67B impressions, desktop and mobile blended | March–August 2026 |
| Advanced Web Ranking | 20.02% desktop (9.69% with an AI Overview); 35.74% mobile | About 1M desktop and 750K mobile US SERPs a month | July 2026 |
| Backlinko and Sistrix (widely quoted) | 27.6% and 28.5% | Older studies from before AI Overviews | Pre-2024 |
Device mix. First Page Sage’s 7.1% blends devices; DataForSEO’s split shows mobile and desktop are now far apart. A blended number depends on how much of the sample is mobile.
AI Overview presence. Both First Page Sage and Advanced Web Ranking find position 1 earns roughly half or less when an AI answer appears. A study’s average depends on how many of its results pages had one, and that share has risen fast in 2026.
Site and query mix. Branded and navigational searches give position 1 a very high CTR, because people are looking for that site. A panel heavy in brand queries will report a higher average than one built from unbranded keywords.
Date. The 27% to 28% figures still circulate in AI answers and listicles. They describe a results page that no longer exists for most queries.
How to read your own CTR
The useful comparison is your own CTR, by device, against your own past and your own curve. Industry benchmarks set a rough expectation, but your brand strength, query mix and SERP layouts decide your real numbers. Search Console has everything you need to make the comparison, if you split it the right way.
- Split by device. Filter Search Console by desktop and mobile separately. Our Google Search Queries report lets you add a device filter and sort by CTR.
- Separate branded and unbranded queries. Branded queries inflate position 1 CTR. Compare unbranded queries to benchmarks like these.
- Compare the same months year over year. CTR swings month to month, as the data above shows. Compare August with August, not August with March.
- Set an impression floor. DataForSEO used at least 1,000 impressions a month. Low-impression queries give noisy CTRs.
- Check the live results page. When CTR drops at a steady position, look at the query. An AI Overview, video carousel or local pack above you changes what a position is worth.
The CTR Gap report does the curve part for you. It fits a click curve from your own site’s last 90 days, refits it weekly and lists the queries and pages earning fewer clicks than their position predicts. When traffic falls, the Click Waterfall splits the change into new, improved, declined and lost queries or pages, so you can see where the clicks went.
What brands should do now
- Re-baseline your traffic forecasts by device. A desktop position 1 that earned about 18% of impressions as clicks in 2025 may earn closer to 7% now. Forecast with your own device split, not a 2025 average.
- Find the queries losing clicks at a steady rank. The CTR Gap report flags queries below your own curve. Check each one’s results page before rewriting titles, because no snippet edit fixes an AI Overview above you.
- Treat positions 2 and 3 on desktop as low-click. At 3.07% and 0.58%, they bring few visits. Look for queries where moving to position 1 or getting cited in the AI answer is realistic, using striking distance data.
- Track AI citations for the same queries. When an AI Overview takes the clicks, being cited in it is the next best outcome. The Citation-Ranking Gap report shows queries where you rank but AI answers cite someone else. Our post on AI Overview citations and click share shows how big that click source has become.
- Report clicks and visibility separately. A ranking that earns fewer clicks can still put your brand in front of buyers. Track impressions, CTR and AI visibility as separate lines.
The takeaway
The top desktop result on Google earns less than half the clicks it did a year ago, while mobile has held up far better. Any CTR benchmark without a date, a device and an AI Overview split will mislead you in 2026. Split your own Search Console data by device, compare it with your own history and check the live results page before you blame a title tag.
 LinkedIn