


Product Performance Revenue and Margin Analysis
The Products report is a product performance report that lists everything that sold in the selected range or sits in your catalogue — 182 products in all — with orders, units, revenue and contribution per product, and stock and list price wherever the catalogue could be matched to the order line.
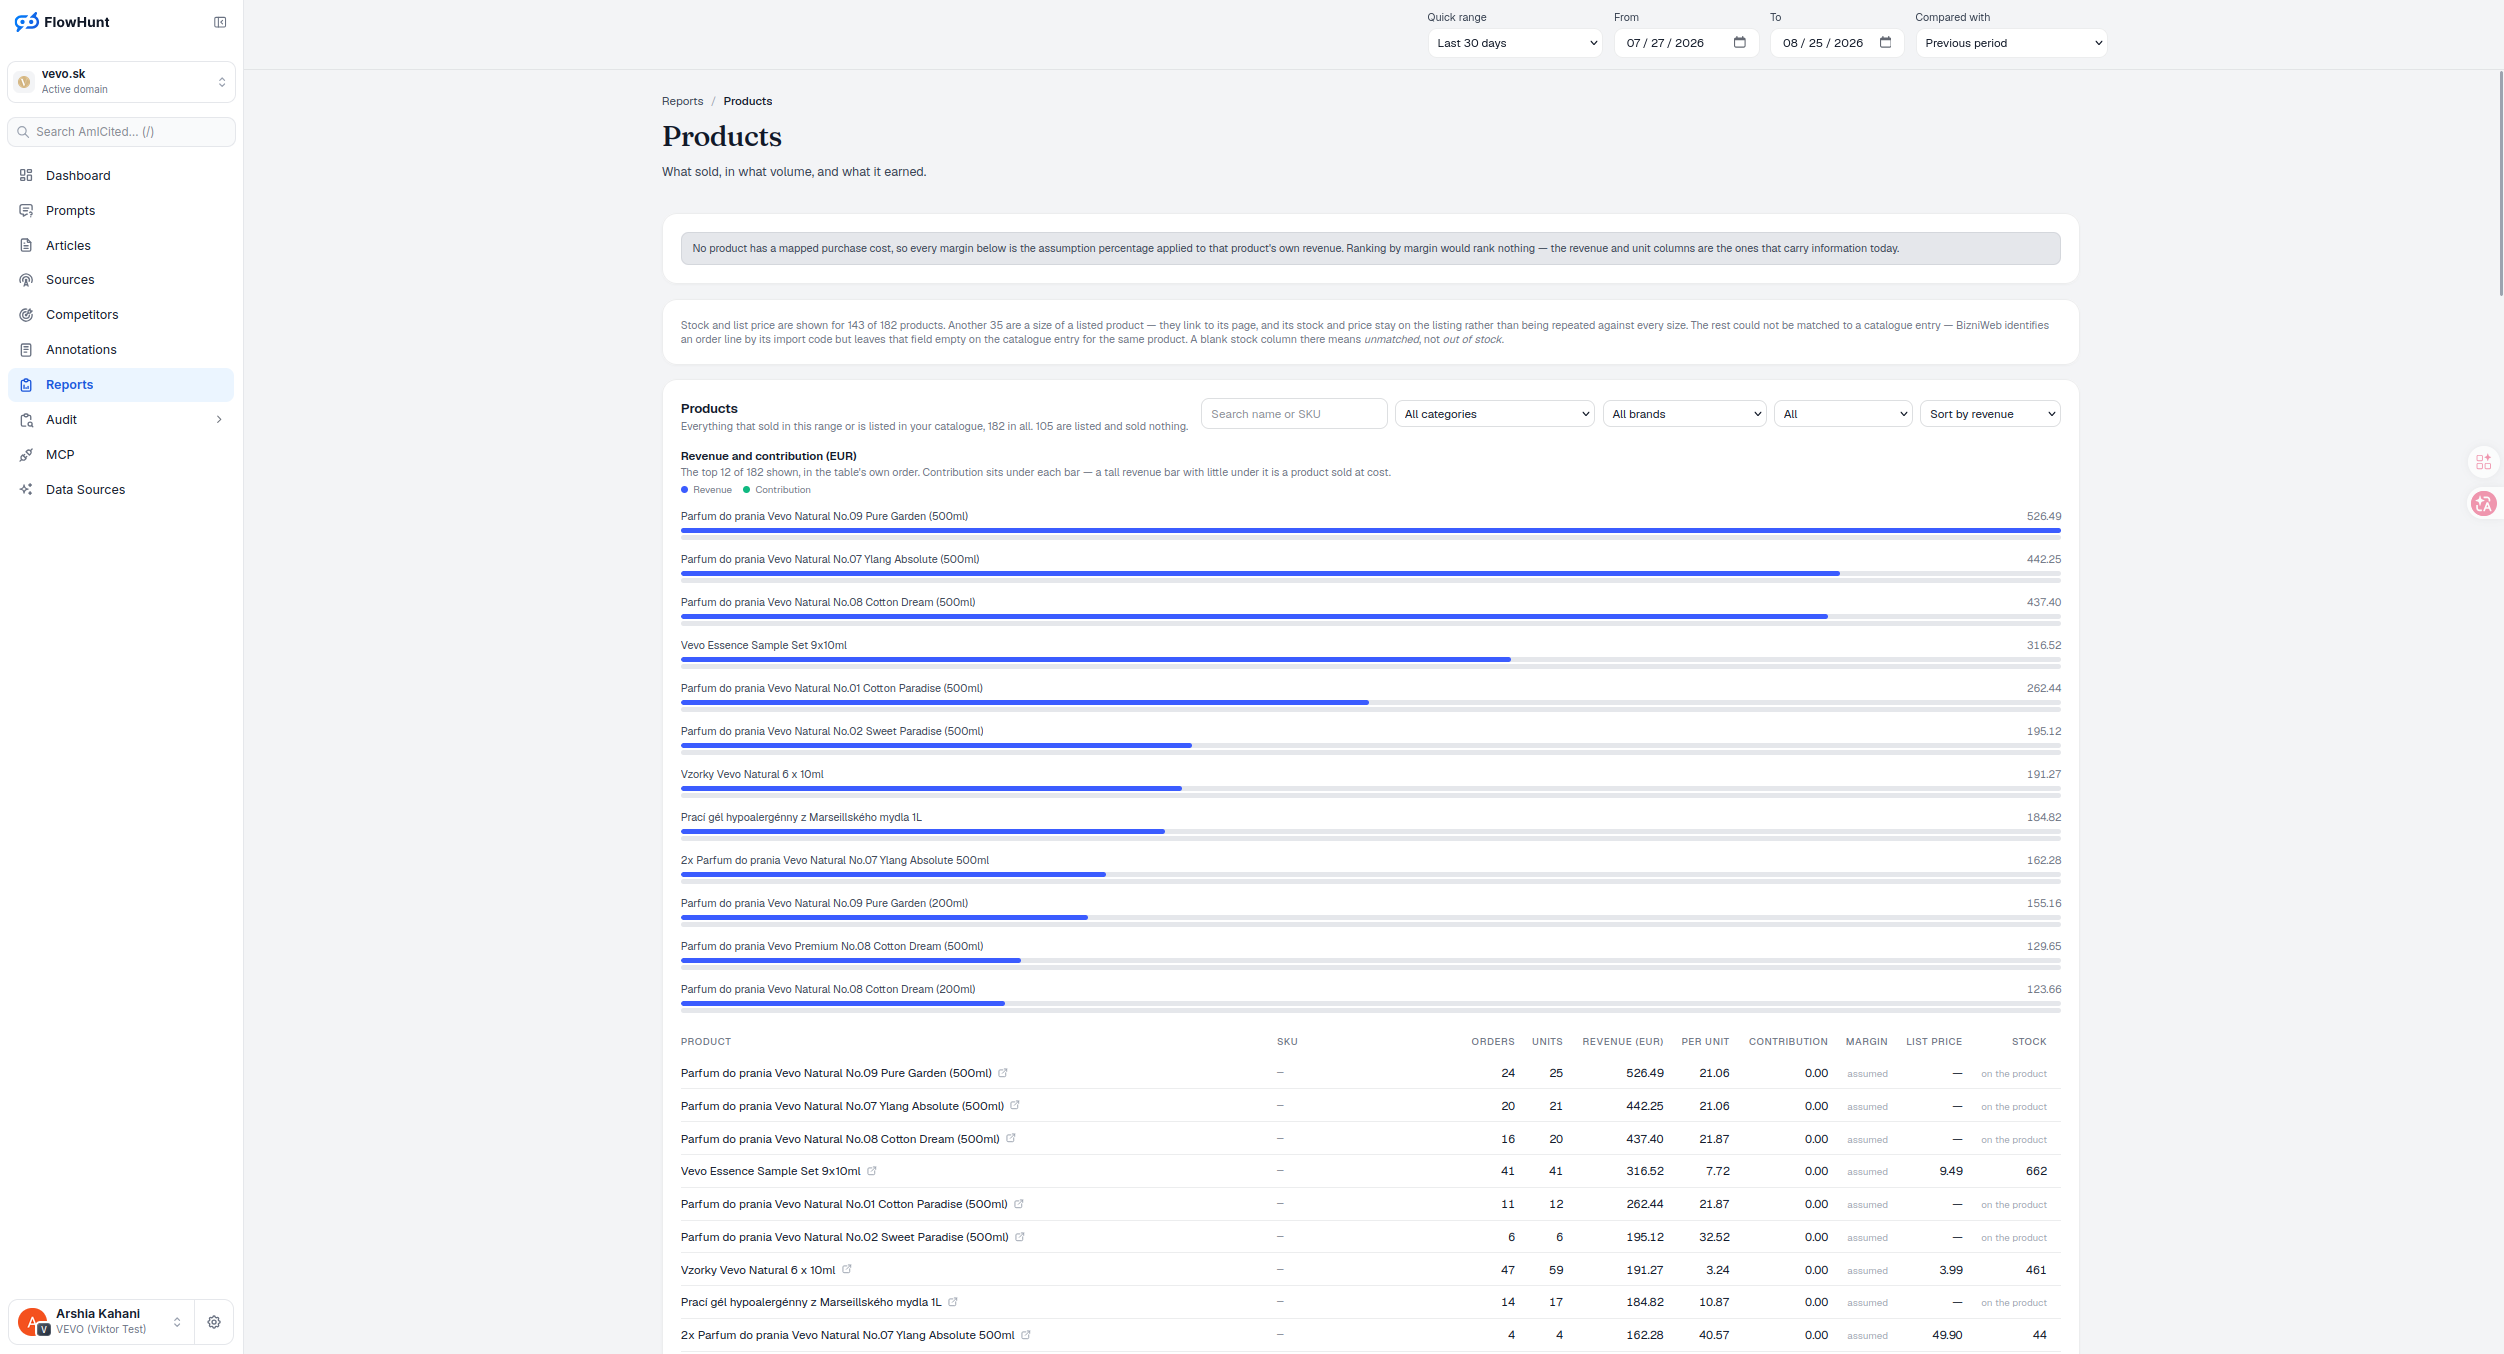
Product Revenue and Cost Confidence
No product here has a mapped purchase cost, so every margin figure is the assumption percentage applied to that product’s revenue — not a measured cost. Ranking by margin would rank nothing but that assumption; revenue and units are the columns that show which products sold, not what they’re assumed to be worth.
- 182 products, 105 sold nothing — the table covers everything that sold in this range or is listed in the catalogue, so a dead product is as visible as a bestseller.
- Revenue and product contribution margin bars — the top 12 of 182, in the table’s own order, contribution stacked under each bar so a tall revenue bar with little under it flags a product sold at cost.
- Search and filter — search by name or SKU, filter by category, brand or stock status, sort by revenue.
- Stock and list price where matched — shown for 143 of 182 products; 35 more are a size of a listed product and link to its page instead of repeating its stock and price.
- Unmatched, not out of stock — a blank stock column means the order line’s import code couldn’t be matched to a catalogue entry, not that the product is unavailable.
- Per-unit and margin columns — orders, units and revenue per unit sit next to contribution and the assumption-based margin for full order-level detail.
- A direction chart, when there’s enough history — a separate view classifies each product’s contribution as rising, flat or falling by comparing the first and second half of the window; it needs at least four selling days with observations in both halves, ten total orders, and no assumed-cost revenue before it will classify anything.
- Chart and table share the same scope — search, category, brand and catalogue-status filters narrow the contribution-trend card as well as the product rows, so the chart never describes products no longer on screen.
Product Performance Table Metrics
Product and SKU identify the row; orders and units are counted, not estimated. Revenue and per-unit revenue are measured from actual order lines. Contribution and margin are what’s left once the missing-cost assumption is applied — useful for a rough read, not for ranking. List price and stock close out the row wherever a catalogue match exists.
- PRODUCT, SKU — identifies the row and links through to the listing for sized variants.
- ORDERS, UNITS — counted directly from order lines matched to this product.
- REVENUE (EUR), PER UNIT — measured revenue and the average per unit sold.
- CONTRIBUTION, MARGIN — the assumption percentage applied to revenue, not a measured cost outcome.
- LIST PRICE, STOCK — populated for 143 of 182 products; blank means the catalogue entry has no import code match, not that the product is out of stock.
Product Revenue Within the Assortment
A single product row only says what sold. Assortment ranks every product by revenue against the whole catalogue’s total, so you can see how much of the range a handful of SKUs actually carry — and Products is where you check what any one of them is worth on its own.
- Same contribution caveat — Assortment ranks by revenue for the same reason this report does: no product here has a mapped cost.
- Cumulative share — see what share of total revenue the top products carry before you decide where to focus.
- Cross-reference by SKU — a product’s row here is the same SKU you’ll find ranked in Assortment.
Product Detail Performance Analysis
Every product name opens a detail page built around that one item: daily revenue, units and orders, purchase cost, achieved price against list price, and the margin that price minus recorded cost actually produces — each series drawn on its own so a missing observation is left out, never zero-filled. Below the charts sit buyer count, lifetime value, customer lifespan, repeat rate, how long returns take, and which products the same buyers order next.
- Five daily charts — revenue; units and orders; purchase cost; achieved price vs. list price; and the margin achieved price minus recorded cost actually produces.
- Achieved vs. list price — a widening gap against list price is discounting; rising purchase cost with a flat achieved price is margin compression.
- Buyer behaviour — buyer count, lifetime value, customer lifespan, repeat rate and how long returns take, plus a ranked list of what the same buyers order next.
- Editable purchase-cost history — add or edit dated cost periods with effective date, unit cost and source, directly on the product.
products, matched against 143 catalogue entries with stock and price
35 more are a size of a listed product and link to its listing rather than repeating stock and price against every size; the rest have no import code match — a blank stock column means unmatched, not out of stock.
See AssortmentAnalyze Product Revenue and Margin
Revenue, units and contribution per product, ranked on what’s measured — with stock and list price wherever the catalogue could be matched.
Ready to see what actually sold?
Free check · 7-day trial · card required