




Marketing mix modeling (MMM) is a statistical method that estimates how much each marketing channel contributed to sales, using weekly totals of spend and results instead of tracking individual users. It answers the budget question platform dashboards can’t: if you move money from one channel to another, what is likely to happen to total sales?
The catch is data. Google’s Meridian documentation asks for at least two years of weekly data for a geo-level model and three years for a national one. Meta’s Robyn guide asks for a minimum of two years of weekly data. Many ecommerce brands don’t have that much clean history, so this guide also covers what to do with less.
Below: how MMM works, how it compares with multi-touch attribution and incrementality testing, and how to read the results, plus one question few MMM guides ask: does paid search raise or lower your organic traffic?
Key Takeaways
- Marketing mix modeling estimates each channel’s contribution from weekly spend and outcome totals. It needs no cookies or user-level tracking, so privacy changes don’t break it.
- Google’s Meridian asks for at least 2 years of weekly data at geo level and 3 years at national level, per its data guide. Meta’s Robyn asks for 2 years of weekly data and about 10 observations per variable.
- Three years of weekly data is only 156 data points. In Meridian’s own example, that is about 15 per parameter for a 10-parameter model, enough for “directional information”.
- Multi-touch attribution splits credit between tracked clicks; incrementality testing compares a group that saw ads with one that didn’t. MMM is the one that covers every channel at once.
- Meridian, Robyn and PyMC-Marketing all accept lift-test results to calibrate the model, which is the standard way to combine MMM with experiments.
- Budget decisions should follow marginal ROI, the return on the next unit of spend, not average ROI. Meridian’s docs say a much lower mROI than ROI signals saturation.
What marketing mix modeling is
Marketing mix modeling is a regression-style model that explains a business outcome, such as weekly revenue, as the sum of a baseline plus the effect of each marketing channel. Because it works on aggregated weekly totals, it can include channels no pixel sees, such as TV, podcasts or print, and it isn’t affected by cookie loss or consent banners.
The output is an estimate of how much each channel added, how efficient it was, and how the outcome would change at different spend levels. That makes MMM a planning tool for marketing budget allocation, not a reporting tool for yesterday’s campaigns.
Media mix modeling is the same method applied to paid media only. Marketing mix modeling, in the strict sense, can also include price, promotions and distribution. Most people use the two names interchangeably, and both are shortened to MMM.

Ready to Monitor Your AI Visibility?
Track how AI chatbots mention your brand across ChatGPT, Perplexity, and other platforms.
How MMM works
An MMM fits one equation to your weekly history: outcome equals baseline, plus seasonality and other controls, plus a transformed effect for each channel. The transformations are what make it more than a plain regression: they model that ads keep working after the week they ran and that each extra unit of spend buys less than the one before.
The building blocks:
| Component | What it captures | Example |
|---|---|---|
| Baseline | Sales you’d get with no marketing: brand, word of mouth, repeat buyers | A store that sells 300 orders a week even when all ads pause |
| Seasonality and controls | Yearly cycles, holidays, promotions, price changes | Black Friday, a summer slump, a 20% sitewide sale |
| Adstock (carryover) | Ads keep influencing sales for weeks after they run | A video campaign whose effect decays over the next 3–4 weeks |
| Saturation (diminishing returns) | Each extra unit of spend adds less than the last | Doubling Meta spend adds 40% more sales, not 100% |
| Priors and credible intervals | What the model assumes before seeing data, and how sure it is after | “Search ROI is between 1.8 and 3.1, with 90% probability” |
The examples in the table are illustrative, not data from a real store.
Google’s Meridian, for example, models carryover with an adstock function and saturation with a Hill curve, whose shape decides whether returns fall off gradually or follow an S-curve.
Bayesian MMM in plain terms
A Bayesian MMM starts with a prior, a stated range of plausible values for each channel’s effect, and updates it with your data. The result is a distribution, summarized as a credible interval: “with 90% probability, this channel’s ROI lies between X and Y.” Meridian’s docs describe priors as starting points: if the data strongly contradicts a prior, the model adjusts.
The practical value is honesty about uncertainty. A wide interval tells you the data can’t separate that channel’s effect from everything else. That is more useful than a single confident number that turns out to be noise.
How much data you need
Plan for two to three years of weekly data. Google’s Meridian asks for at least two years at geo level and three years at national level, or three years if you only have monthly data. Robyn asks for at least two years of weekly data and about one variable per ten observations. Less data means wider intervals and more weight on the model’s assumptions.
Why so much? Two reasons:
- Seasonality repeats once a year. With 52 weeks, the model sees each holiday once and can’t tell whether sales rose because of Black Friday or because you raised spend that week. Two or three cycles let it separate the two.
- Every channel adds parameters. Each channel needs at least an effect size, a carryover rate and a saturation shape. Meridian’s docs work through a national model with 10 parameters and 156 weekly data points, about 15 data points per parameter, and call that enough to “glean some directional information.”
The same page says the guidance is “rough and directional,” and that the most accurate check is to fit the model and look at the width of the credible intervals.
Spend variation matters as much as history length. If a channel spent the same amount every week for two years, the model has nothing to learn from. Meridian’s docs note that insufficient variation in media spend hurts national models.
What to do with less than three years
Most ecommerce brands have one to two years of usable data, often less after a tracking change or a replatform. You can still model, if you adjust what you expect from it:
- Backfill older spend. Ad platforms and invoices often hold more history than your analytics tool. Enter it as costs rather than starting from the day you connected.
- Merge small channels. Meridian’s data guide advises combining low-spend channels with others to avoid unstable ROI estimates. Fewer, larger channels give each estimate more data.
- Use geo-level data if you have it. Geo models share information across regions, so the same weeks yield more data points per effect, per Meridian’s guide.
- Calibrate with a lift test. One well-run experiment on your largest channel gives the model a much tighter prior than its defaults.
- Vary spend on purpose. Planned step changes or short pauses in one channel create the variation the model needs.
- Read the output as indicative. With a year or less, yearly seasonality is partly a guess. Use the model to rank channels and spot saturation, not to promise a revenue number.
Stay Updated on AI Visibility Trends
Get the latest insights on AI mentions, brand monitoring, and optimization strategies.
MMM vs attribution vs incrementality
Marketing mix modeling, multi-touch attribution and incrementality testing answer three different questions. MMM estimates what each channel contributed to total sales over time. Multi-touch attribution splits credit for each tracked conversion between the touchpoints it saw. Incrementality testing measures whether one activity caused extra sales by comparing exposed and unexposed groups.
| Marketing mix modeling | Multi-touch attribution | Incrementality testing | |
|---|---|---|---|
| Question | What did each channel contribute, and where should the next unit of budget go? | Which tracked touchpoints were on the path to each conversion? | Did this campaign cause sales that wouldn’t have happened anyway? |
| Data | Weekly spend, impressions and outcome totals, 2–3 years | User-level clicks, views and conversions | A test group and a control group, during the test |
| Cookies and privacy | None needed; aggregated data only | Depends on cookies, pixels and consent | User-based tests rely on ad-platform identity; geo tests use regions only |
| Speed | Slow to set up; weekly or monthly refresh | Near real time | Weeks per test |
| Cost | Open source is free but needs skills; hosted tools charge a fee | Often bundled in analytics and ad tools | Withheld ads or holdout regions, plus setup time |
| Granularity | Channel or campaign group | Campaign, ad, keyword | One channel, campaign or region at a time |
| Best for | Cross-channel budget allocation, offline media | Day-to-day campaign optimization | Proving causality, calibrating models |
| Main weakness | Observational estimate; needs long, varied history | Credit isn’t causation; misses untracked and offline touchpoints | Narrow: answers one question per test |
Multi-touch attribution and single-touch models like last-click attribution count conversions they can see. Ad platforms count their own, which is why Meta’s numbers rarely match your store’s; our Meta Attribution Reality report puts the two side by side. None of these prove that an ad caused a sale.
Incrementality testing is the experiment that can. Google describes its Conversion Lift as a way to split your audience into people who see your ads and people who don’t and measure the difference; it notes the tool isn’t available for all Google Ads accounts. A geo holdout works the same way with regions: pick matched regions, pause or change spend in some, and compare sales against the rest. Unlike a website A/B test, which compares two versions of a page, a lift test compares ads against no ads.
How they work together
The standard setup uses MMM for the budget split, attribution for daily optimization inside a channel, and lift tests to check and calibrate the model. Calibration means turning an experiment’s result into the prior for that channel, so the model starts from measured evidence instead of a generic assumption. All three main open-source MMMs support it.
- Meridian defines calibration as
“using experiment results and other domain knowledge to set channel-specific priors”, and includes a
CalibrationBuilderthat turns incrementality experiments into ROI priors. - Robyn “strongly recommend[s]” experimental results as ground truth for calibration, accepts them only as point estimates, and advises against using studies whose confidence is low, per its analyst’s guide.
- PyMC-Marketing lists lift-test calibration as a core feature.
A practical cycle: fit the model, find the channel with the widest interval or the biggest budget, run one lift test on it, feed the result back, and refit. Each test narrows the model where it matters most.
How to read MMM results
Read four outputs in this order: contribution (how much of the outcome each channel explains), ROI (average return on everything spent), marginal ROI (return on the next unit of spend), and response curves (how return changes as spend rises). Base budget moves on marginal ROI and the curves, and check the credible interval before acting on any single number.
- Contribution is the share of the outcome the model attributes to each channel, with the baseline usually the largest part.
- ROI is incremental outcome divided by spend. If the outcome is revenue, ROI is revenue, not profit. For example, a channel with ROI of 2 at a 40% gross margin loses money once product costs are in. Our post on breakeven ROAS, true ROAS, MER and POAS covers the margin math.
- Marginal ROI (mROI) is the return on the next unit above current spend. Meridian’s docs say that when mROI is much lower than ROI, the channel is beginning to saturate.
- Response curves show the modeled outcome at different spend levels for one channel, holding the others fixed. Meridian warns that points far above or below historical spend are extrapolations.
Example: a model gives Google Ads non-brand search an ROI of 3.0 and an mROI of 1.2, and Meta prospecting an ROI of 2.0 and an mROI of 1.9. Search has the better average, but the next 1,000 does more on Meta. That is the next-dollar question, and it is why ranking channels by average ROI or platform ROAS leads to the wrong budget split.
Does paid search change organic traffic?
Most MMMs treat organic search as a baseline or a control and ignore one of the most common budget questions: when you bid on a term, do you lose organic clicks you’d have earned anyway, or do ads lift your organic visibility? A marketing mix model can estimate this by making organic clicks or sessions the outcome and paid channels the inputs.
The answer differs by account and by keyword type, and the effect can go either way. Brand search ads may take clicks your first organic result would have earned; non-brand ads may raise awareness that later shows up as branded organic searches. We cover the evidence and how to test it in does Google Ads increase organic traffic?.
Two inputs make this measurable: weekly organic traffic from Search Console, Bing Webmaster Tools or GA4, and paid search spend split by campaign type. A paid-to-organic model gives a signed estimate: positive means ads add organic clicks, negative means they take them.
Common MMM mistakes
The most common mistakes come from feeding the model incomplete data or reading its output as certain. A model can’t separate channels that always move together, can’t learn seasons it has seen once, and treats missing spend as zero spend. Check the inputs before trusting the outputs.
- Missing spend counted as zero. If an import misses three months of Meta spend, the model sees three months of sales with no Meta and concludes Meta did little.
- Channels that always move together. If search and social budgets rise and fall in lockstep, no model can split their effects. Vary one independently.
- Too many small channels. Twelve channels with tiny budgets give twelve wide intervals. Group them.
- Ignoring promotions and price changes. A sale week credited to whatever ran that week inflates that channel.
- Reading ROI as profit. Revenue ROI ignores margins, shipping and returns.
- Acting on point estimates. If a channel’s interval spans losing and winning, the honest verdict is “unclear,” not a budget shift.
- Never validating. Without a lift test or a holdout forecast check, you can’t tell a good model from a confident one.
Who should use MMM
Marketing mix modeling pays off when you spend meaningfully on three or more channels, your spend changed over time, and you have at least two years of weekly data. It is less useful for a brand on one or two channels, with flat budgets, or with under six months of history: there the model has too little to separate.
Good fits:
- Ecommerce brands spending on search, social and at least one more channel, such as ChatGPT ads, LinkedIn, affiliates or offline media.
- Teams whose platform-reported conversions add up to more than their store’s real orders.
- Brands that lost visibility in attribution after consent and cookie changes.
- Anyone asking whether brand search ads are worth it.
Poor fits:
- A store spending almost everything on one platform; a lift test on that platform answers more.
- Brands with under six months of history, or a recent replatform that broke tracking.
- Teams that want campaign- or ad-level answers daily; that’s attribution’s job.
Which should you choose?
Pick the method by the decision you’re making. Use MMM for splitting a budget across channels, attribution for optimizing inside a channel day to day, and an incrementality test when you need proof that one channel or campaign drives sales. Most brands spending across several channels end up using all three, each for its own question.
| Your situation | Start with | Add later |
|---|---|---|
| Splitting next quarter’s budget across 3+ channels | MMM | Lift test on the largest channel |
| Optimizing bids, audiences or creatives this week | Attribution and platform data | MMM for the channel-level split |
| Proving that a channel causes sales before scaling it | Incrementality test | MMM calibrated with the result |
| Under a year of data, 2+ channels | Lift test, plus MMM read as indicative | Standard MMM once you reach 2–3 years |
| Spending on offline media (TV, print, podcasts) | MMM | Geo holdout test |
| Bidding on your own brand name | Paid-to-organic MMM or a brand-pause test | Search term gap review |
MMM tools: open source and hosted
MMM tools fall into two groups: free open-source libraries you run yourself, and hosted products that run a model for you. The three main open-source options are Google’s Meridian, Meta’s Robyn and PyMC-Marketing; they are free but need Python or R, data preparation and model checks. Hosted tools trade a fee for setup, connectors and a user interface.
| Tool | Type | What its own site says (as of November 2026) |
|---|---|---|
| Google Meridian | Open source, Python | Bayesian MMM with geo-level support; released to everyone on January 29, 2025; a no-code Scenario Planner followed in February 2026 |
| Meta Robyn | Open source, R (Python API in beta) | “Experimental” MMM package from Meta Marketing Science; ridge regression with evolutionary hyperparameter search; MIT licensed |
| PyMC-Marketing | Open source, Python | Bayesian MMM with adstock, saturation, lift-test calibration and budget optimization; Apache 2.0 |
| Recast | Hosted | Proprietary Bayesian MMM with GeoLift experiments; no public price |
| Cassandra | Hosted | MMM and incrementality tests, no data team needed; 30-day free trial |
| MarSci | Hosted | Runs Meridian or Robyn on your data; needs at least €1,000 a day in marketing spend |
| MMM Pilot | Hosted | Runs Robyn without code; Starter plan $50/month |
| AmICited | Hosted (our product) | Runs Meridian; sales and paid-to-organic models; Premium and Enterprise plans |
For a side-by-side of the two big open-source engines, see Google Meridian vs Robyn.
MMM in AmICited
AmICited is our product. Its Media Marketing Mix (MMM) runs a Bayesian model on Google Meridian for you, with no code. You choose an outcome, such as store revenue from Shopify or WooCommerce, GA4 purchases or any GA4 conversion, and channels from five connected ad platforms plus custom costs for anything else.
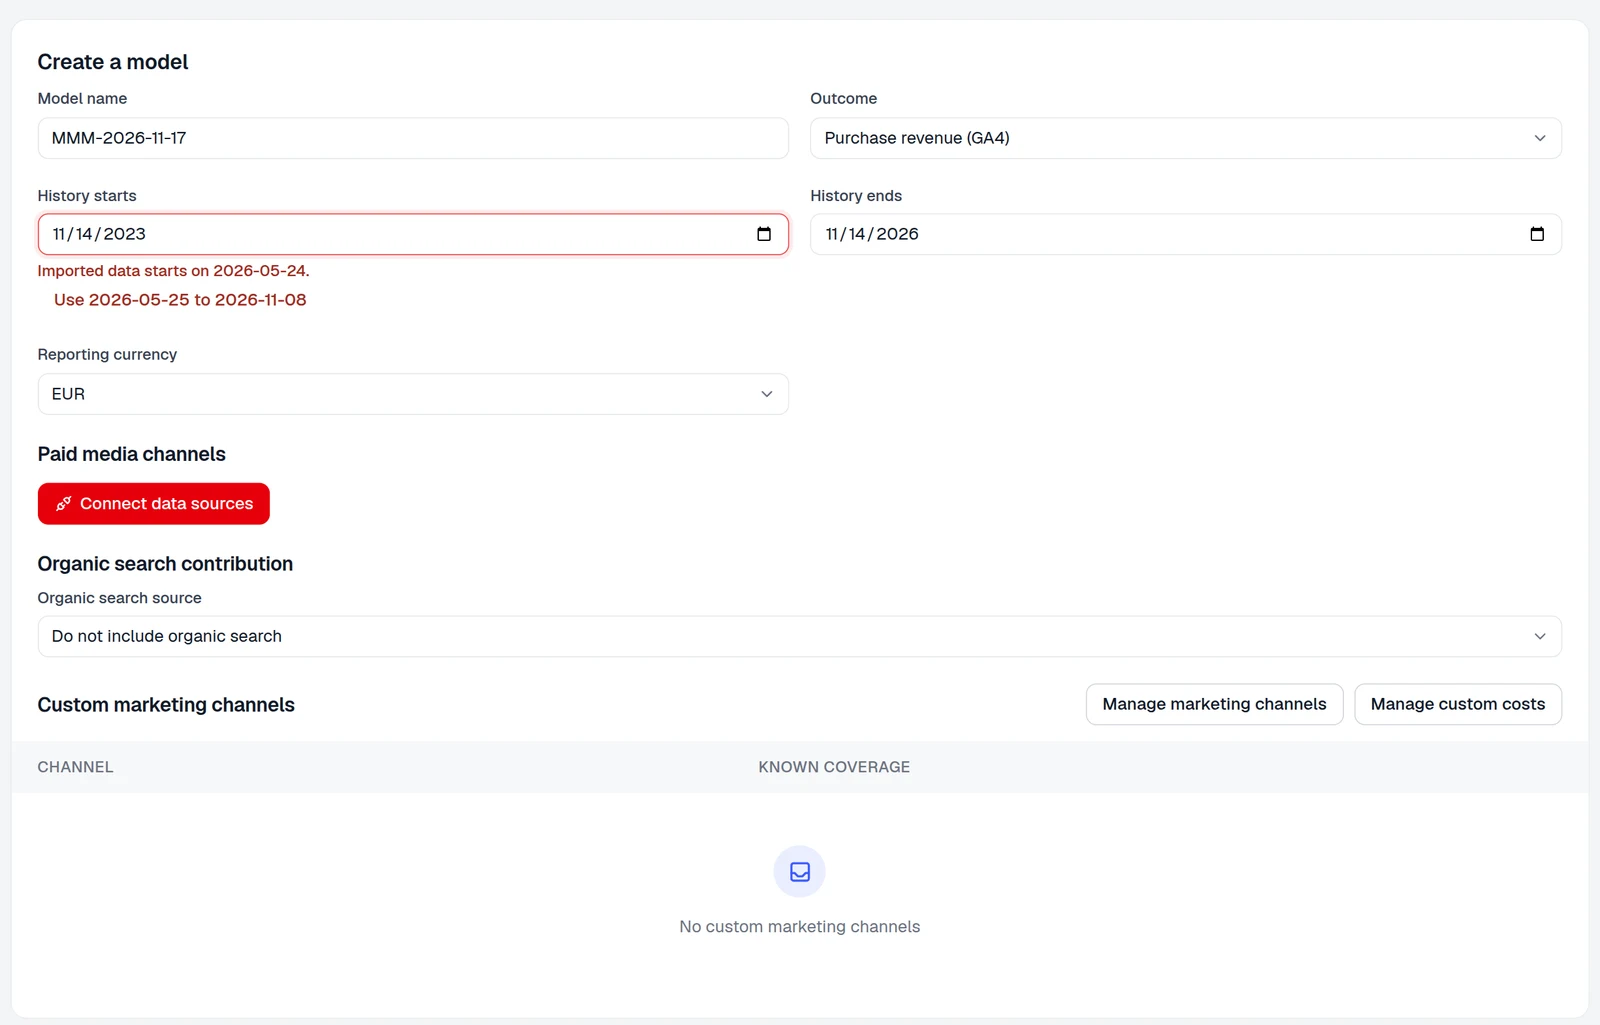
What it adds over running Meridian yourself is the setup and the paid-to-organic model: set the outcome to Search Console, Bing or GA4 organic traffic and it estimates how paid search changes organic clicks over time. Outputs include contributions with 90% credible intervals, response curves from zero to three times current spend, where the next 1,000 does the most, and a best split of the current budget.
Its limits are real. It is on the Premium and Enterprise plans only, with a model package charge. A standard model needs 164 complete weeks; with 24 or more it runs in a limited-history mode whose recommendations are labeled indicative only. ROI is revenue, not profit. And like any MMM, it estimates from history; it doesn’t replace a lift test.
What to do now
- List your channels and history. Count the weeks of complete spend and outcome data you have for each channel. Under two years means indicative results.
- Fix the inputs first. Fill spend gaps, mark promotions and price changes, and check that your store revenue and your revenue attribution agree on totals.
- Compare platform claims with real orders. Use Meta Attribution Reality or your own store export to see how far platform numbers drift.
- Fit a first model. Run Meridian, Robyn or PyMC-Marketing yourself, or a hosted tool such as our Media Marketing Mix.
- Act on mROI and intervals. Move budget only where the marginal return is clearly higher and the interval doesn’t span zero.
- Test the biggest bet. Run one lift test or geo holdout on your largest channel and calibrate the model with it.
- Check paid against organic. Review search terms you pay for without an organic page in Paid-Proven Gaps, and model whether paid search lifts or replaces organic clicks.
The takeaway
Marketing mix modeling is the only one of the three main measurement methods that covers every channel at once without tracking users. It needs two to three years of weekly data, varied spend and honest inputs, and it returns estimates with ranges, not facts. Use it to split the budget, use lift tests to check it, and read the next-dollar return rather than the average.
 LinkedIn