



Breakeven ROAS is 1 divided by your contribution margin: the return on ad spend at which ad-driven orders exactly pay for their ads. A store that keeps 40% of each sale after product cost, shipping, payment fees and returns breaks even at a ROAS of 2.5. Below that, every ad-driven order loses money; above it, the ads add contribution toward fixed costs and profit.
The formula is simple. The hard part is the two inputs. The margin has to include every cost that grows with an order, and the revenue has to be revenue your store actually kept. Most ROAS calculators take the margin you type in and the ROAS your ad platform reports, and that reported number is calculated on revenue the platform attributes to itself.
This guide gives the formulas for breakeven ROAS, target ROAS, true ROAS, blended ROAS, MER and POAS, a worked example with every number shown, a spreadsheet calculator you can copy, and a table of which metric to use for which decision.
Key Takeaways
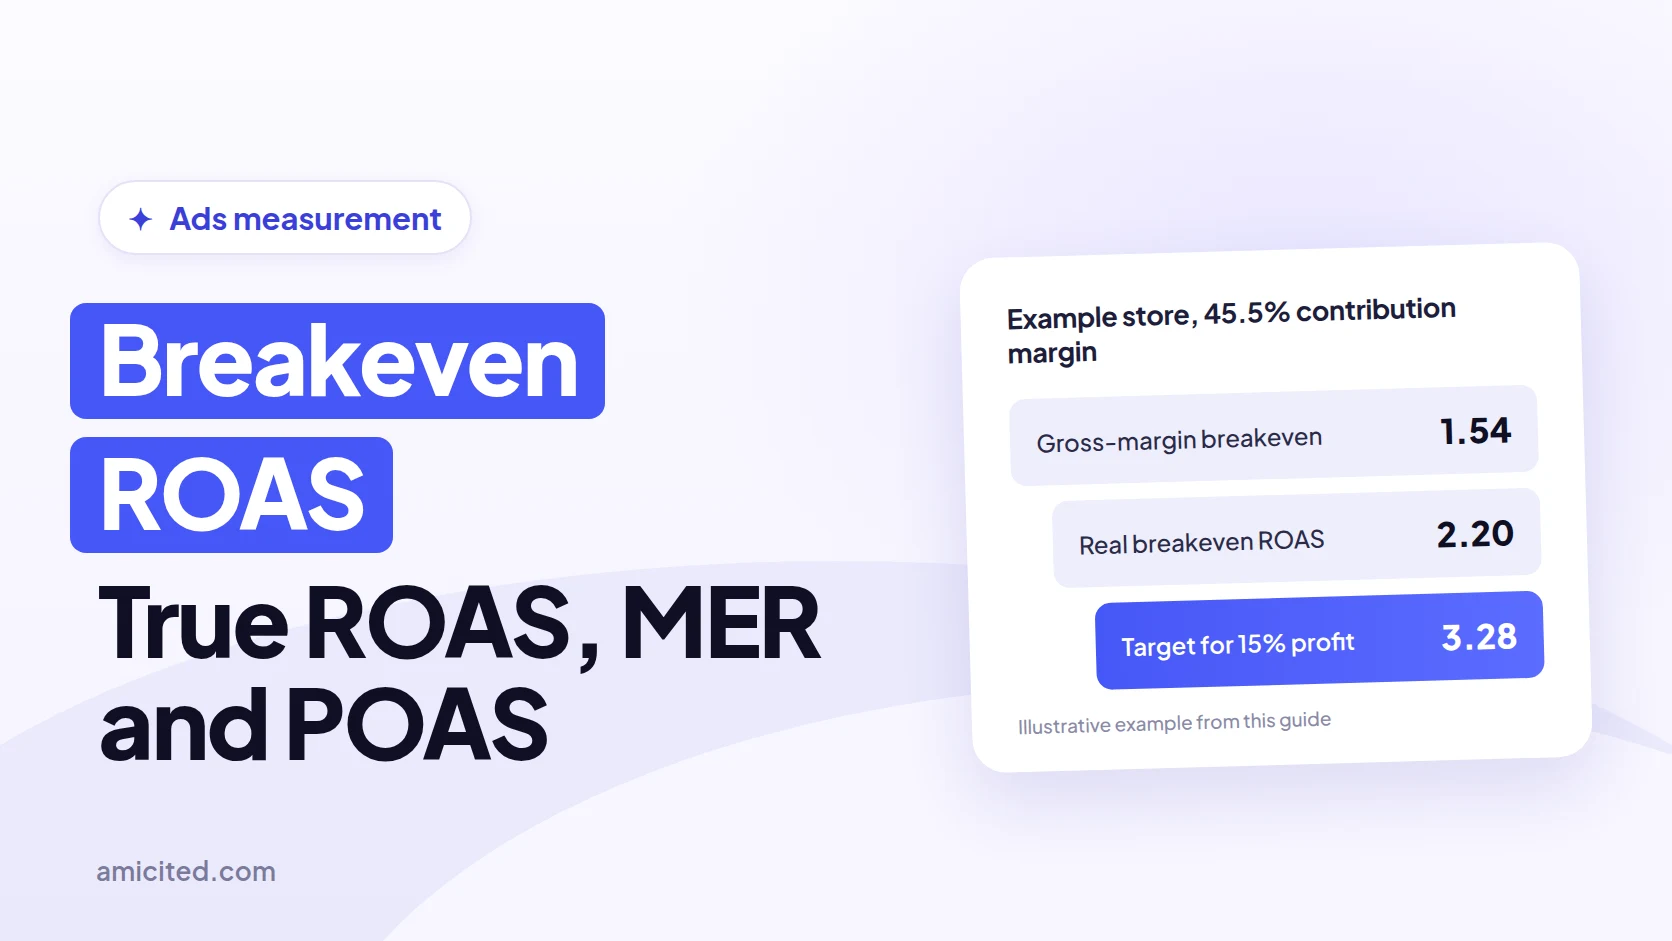
- Breakeven ROAS = 1 ÷ contribution margin. At a 45.5% contribution margin it’s 2.20; at 20% it’s 5.00.
- Using gross margin instead of contribution margin understates breakeven. In our illustrative store, gross margin says 1.54 and the real breakeven is 2.20.
- Target ROAS for a profit goal = 1 ÷ (contribution margin − desired profit margin). A 15% goal on a 45.5% margin needs 3.28, entered in Google Ads as 328%.
- Platform ROAS uses revenue the ad platform attributes to itself. In the example, Meta and Google together claim $110,000 of a store’s $100,000 revenue.
- MER and POAS aren’t standardized. Triple Whale’s documentation defines MER as spend ÷ sales and POAS as gross profit ÷ spend, the inverse and a looser version of common definitions.
- New-customer ROAS can sit below breakeven while blended ROAS looks healthy, which only works if repeat purchases pay back the acquisition cost.
What breakeven ROAS is
Breakeven ROAS is the return on ad spend at which the contribution from ad-driven orders equals the ad spend, so the ads neither make nor lose money before fixed costs. ROAS, return on ad spend, is revenue divided by ad spend. Breakeven ROAS turns that ratio into a floor you can compare any campaign against.
The input that decides it is contribution margin. Contribution margin is the share of revenue left after every variable cost of an order: product cost, packaging, net shipping, payment fees and returns. Fixed costs such as salaries, rent and software stay out, because they don’t change with one more order. Ad spend also stays out, because breakeven is the point where ads use up the contribution.
Breakeven is a floor, not a goal. A campaign running exactly at breakeven pays for its ads and nothing else, so your fixed costs and profit have to come from somewhere else.

Ready to Monitor Your AI Visibility?
Track how AI chatbots mention your brand across ChatGPT, Perplexity, and other platforms.
Breakeven ROAS formula and related metrics
Breakeven ROAS = 1 ÷ contribution margin, with the margin written as a decimal. Every other metric in this cluster changes either the revenue on top (platform-attributed, store, new-customer) or the cost underneath (ad spend, all marketing, profit). The table lists each formula and what it tells you.
| Metric | Formula | What it answers |
|---|---|---|
| ROAS (platform ROAS) | Revenue the platform attributes to its ads ÷ that platform’s ad spend | How a campaign performs by the platform’s own count |
| Breakeven ROAS | 1 ÷ contribution margin (or average order value ÷ contribution per order) | The minimum ROAS before ads lose money |
| Target ROAS for a profit goal | 1 ÷ (contribution margin − desired profit margin) | The ROAS that leaves the profit share you want after ads |
| Blended ROAS | Total store revenue ÷ total ad spend, all platforms | Whether paid media as a whole is efficient |
| MER (marketing efficiency ratio) | Total store revenue ÷ total marketing costs (ads, agencies, creators, tools) | Whether marketing as a whole pays for itself |
| True ROAS | Realized store revenue (after refunds and cancellations) ÷ ad spend | Return on revenue the store actually kept |
| POAS (profit on ad spend) | Contribution before ads ÷ ad spend (some tools use gross profit) | Whether ads create profit, not just revenue; 1.0 is breakeven |
| New-customer ROAS | Revenue from first-time customers ÷ ad spend | Whether ads are buying growth or recycling existing buyers |
| Revenue ROAS (AmICited) | Realized net revenue ÷ Meta spend | Return on realized revenue, before costs |
| CM2 ROAS (AmICited) | CM2 (revenue − product cost − packaging, net shipping, payment fees, refunds) ÷ Meta spend | Unit economics against spend |
| CM3 ROAS (AmICited) | CM3 (CM2 − advertising) ÷ Meta spend | Contribution left after advertising, per unit of spend |
Two of these lack a single agreed definition. Triple Whale’s metric documentation defines MER as “Blended Spend / Sales Before Refunds”, the inverse of the revenue-over-spend version, and POAS as “Gross Profit / Blended Spend”. The same store can show an MER of 2.86 in one tool and 35% in another, so write down which definition you use before you set targets on it.
The last three rows are how AmICited’s Profit-true ROAS report defines the contribution ladder: CM1 is revenue minus product cost, CM2 also subtracts packaging, net shipping, payment fees and refunds, and CM3 subtracts advertising. When the spend in the denominator is all of the advertising, CM3 ROAS equals CM2 ROAS minus 1, so a CM2 ROAS above 1 and a CM3 ROAS above 0 both mean the same thing: the ads paid for themselves.
A worked breakeven ROAS example
Example: a store with an $80 average order value keeps $36.38 per order after all variable costs, a 45.5% contribution margin, so its breakeven ROAS is 2.20. The store and every number below are illustrative, chosen so the arithmetic is easy to check, not data from a real shop.
| Per order | Amount | Share of order value |
|---|---|---|
| Average order value (after discounts, without sales tax) | $80.00 | 100% |
| Product cost | −$28.00 | 35.0% |
| Packaging and pick-and-pack | −$3.00 | 3.75% |
| Net shipping (what you pay minus what the customer paid) | −$6.00 | 7.5% |
| Payment fees (2.9% + $0.30) | −$2.62 | 3.3% |
| Returns allowance (5% of revenue) | −$4.00 | 5.0% |
| Contribution per order | $36.38 | 45.5% |
Breakeven ROAS = $80.00 ÷ $36.38 = 2.20. Put differently, the store can spend up to $36.38 on ads to win one order and still break even. That figure is its breakeven cost per acquisition (CPA).
Now scale it to a month. The store takes 1,250 orders, $100,000 in revenue, and spends $20,000 on Meta ads, $10,000 on Google Ads and $5,000 on an agency, creators and tools.
| Monthly line | Amount |
|---|---|
| Store revenue (1,250 × $80) | $100,000 |
| Product cost | −$35,000 |
| CM1 (after product cost) | $65,000 |
| Packaging $3,750, net shipping $7,500, payment fees $3,275, returns $5,000 | −$19,525 |
| CM2 (contribution before ads) | $45,475 |
| Ad spend (Meta $20,000 + Google $10,000) | −$30,000 |
| CM3 (contribution after ads) | $15,475 |
| Other marketing (agency, creators, tools) | −$5,000 |
| Left to cover fixed costs and profit | $10,475 |
The same month, read through each metric:
| Metric (example store) | Calculation | Result | Against breakeven |
|---|---|---|---|
| Meta platform ROAS | $70,000 Meta-attributed ÷ $20,000 | 3.50 | Above 2.20 |
| Google platform ROAS | $40,000 Google-attributed ÷ $10,000 | 4.00 | Above 2.20 |
| Blended ROAS | $100,000 store revenue ÷ $30,000 ad spend | 3.33 | Above 2.20 |
| MER | $100,000 ÷ $35,000 all marketing costs | 2.86 | Not comparable (includes non-ad costs) |
| POAS on contribution (= CM2 ROAS) | $45,475 ÷ $30,000 | 1.52 | Above 1.00 |
| CM3 ROAS | $15,475 ÷ $30,000 | 0.52 | Above 0 |
| New-customer ROAS | $48,000 ÷ $30,000 | 1.60 | Below 2.20 |
Together Meta and Google claim $110,000, more than the store’s entire $100,000, and some of that revenue came from email, organic search and repeat buyers. Both platform numbers clear the 2.20 breakeven easily, and so does blended ROAS at 3.33. The contribution view agrees for the month as a whole: CM3 is positive, and POAS of 1.52 means each ad dollar returned $1.52 of contribution. POAS on gross profit would be $65,000 ÷ $30,000 = 2.17, which is why the definition matters.
The growth view doesn’t agree. In the example, 600 of the 1,250 orders came from first-time customers, $48,000 of revenue. New-customer ROAS is $48,000 ÷ $30,000 = 1.60, below breakeven, and blended new-customer CAC is $30,000 ÷ 600 = $50 against $36.38 of first-order contribution. Each new customer starts $13.62 in the red, and the ads pay back only if enough of them buy again. That’s a customer lifetime value question, not a ROAS one.
Stay Updated on AI Visibility Trends
Get the latest insights on AI mentions, brand monitoring, and optimization strategies.
Do-it-yourself ROAS calculator
A spreadsheet with ten inputs gives you breakeven ROAS, target ROAS and the Google Ads percentage. You don’t need a calculator tool; you need honest inputs. Pull them from your store’s order export and invoices for the last 90 days or more, so one promotion or one bad week doesn’t set your floor.
- Enter average order value. Use net sales after discounts, without sales tax or VAT, divided by orders.
- Enter product cost per order. Use landed cost, including inbound freight and duties.
- Enter packaging and pick-and-pack per order. Include 3PL fees if you use one.
- Enter net shipping per order. Subtract what customers paid for shipping from what you paid carriers.
- Enter payment fees. Use your processor’s percentage and fixed fee per transaction.
- Enter a returns allowance. Use refunded revenue as a share of revenue, plus return shipping if you pay it.
- Enter your profit goal. Use the share of revenue you want left after ads.
- Read the outputs. Compare breakeven and target ROAS with campaign ROAS measured on store revenue, not only platform-attributed revenue.
Copy this into Google Sheets or Excel, with labels in column A and values in column B. The values shown are the example store’s:
A                                    B
1  Average order value               80
2  Product cost per order            28
3  Packaging and pick-and-pack       3
4  Net shipping per order            6
5  Payment fee %                     2.9%
6  Payment fee fixed                 0.30
7  Returns allowance %               5%
8  Desired profit % of revenue       15%
9  Payment fees per order            =B1*B5+B6                → 2.62
10 Returns per order                 =B1*B7                   → 4.00
11 Variable costs per order          =B2+B3+B4+B9+B10         → 43.62
12 Contribution per order            =B1-B11                  → 36.38
13 Contribution margin               =B12/B1                  → 45.5%
14 Breakeven ROAS                    =1/B13                   → 2.20
15 Breakeven CPA                     =B12                     → 36.38
16 Target ROAS                       =1/(B13-B8)              → 3.28
17 Google Ads target ROAS %          =B16*100                 → 328
Google Ads defines target ROAS as “the average conversion value (for example, revenue) you’d like to get for each dollar you spend on ads” and takes it as a percentage, so $5 in sales per $1 of spend is entered as 500%. Keep in mind that Google bids against the conversion value it measures, so if that value includes tax or shipping, or isn’t net of returns, raise the target to match.
Breakeven ROAS by margin
Low-margin products need a much higher ROAS to break even, because the breakeven rises steeply as contribution margin falls. Halving the margin doubles the breakeven ROAS. If your catalog mixes high- and low-margin products, one store-wide breakeven hides products that lose money on every ad-driven sale.
| Contribution margin | Breakeven ROAS | Target ROAS for 10% profit |
|---|---|---|
| 60% | 1.67 | 2.00 |
| 50% | 2.00 | 2.50 |
| 40% | 2.50 | 3.33 |
| 30% | 3.33 | 5.00 |
| 20% | 5.00 | 10.00 |
| 10% | 10.00 | not reachable |
At a 10% contribution margin, a 10% profit goal leaves nothing for ads at all. Calculate breakeven per product group when margins differ by more than a few points, and set campaign targets from the products each campaign actually sells.
Platform ROAS vs true ROAS
Platform ROAS divides the revenue an ad platform attributes to its own ads by that platform’s spend; true ROAS divides revenue the store actually kept by the same spend. The two differ because each platform counts by its own rules, and because the platform rarely learns about refunds. The gap is often largest exactly where you need the number most.
Three effects push platform ROAS above true ROAS:
- Attribution rules. Meta’s Ads Insights API describes its default window as 7-day click and 1-day view, so a purchase a day after someone only saw an ad can count. Shopify’s marketing attribution documentation warns that “each platform credits sales by using its own rules”, so one sale can be counted by more than one platform.
- Refunds and cancellations. The platform records a purchase at checkout. Your realized revenue drops later, when the order is refunded or cancelled.
- Revenue basis. The purchase value a pixel sends may include tax or shipping, or use a different currency, while your contribution margin is calculated on net revenue.
So compare breakeven ROAS against ROAS on realized store revenue, not against the number in Ads Manager. Our guide to why Meta reports more conversions than your store walks through reconciling the two, and AmICited’s Meta Attribution Reality report shows Meta’s claimed purchases and value next to realized orders and net revenue, day by day.
Which metric to use when
Use each metric for the decision it was built for: platform ROAS to tune campaigns inside one platform, blended ROAS and MER to judge the business, POAS or contribution ROAS to decide whether ads make money, and new-customer metrics to judge growth. None of them replaces the others, and arguing about which one is “right” usually means two teams are answering different questions.
| Decision | Metric | Why | Watch out for |
|---|---|---|---|
| Bids, creatives and audiences inside Meta or Google | Platform ROAS | It’s the signal the platform optimizes on, and comparisons within one platform are consistent | Don’t compare platforms with it or add platforms up |
| Is paid media working overall this week? | Blended ROAS | Uses store revenue, so no double counting | Includes organic, email and repeat revenue |
| Total marketing budget and board reporting | MER | Covers every marketing cost, not just media | Definitions vary; it’s revenue, not profit |
| Do the ads make money? | POAS, CM2 ROAS or CM3 ROAS | Includes product and order costs | Needs complete cost data; gross-profit POAS runs high |
| Are we buying growth? | New-customer ROAS, new-customer CAC | Separates first purchases from repeat orders | First-order loss can be fine if repeat rates support it |
| Should we scale a campaign? | Contribution ROAS against breakeven, at the margin | Shows whether the next dollar still clears the floor | Averages hide diminishing returns |
A practical cadence: platform ROAS daily, blended ROAS and POAS weekly, MER and new-customer CAC monthly alongside cohort repeat rates. If you need to know what each channel causes rather than what it gets credited with, that’s a job for a marketing mix model or an incrementality test, not for any of these ratios.
Common breakeven ROAS mistakes
The most expensive mistakes come from the inputs, not the formula. Each of the six below makes breakeven look lower or ROAS look higher than it is, so campaigns that lose money pass the check.
- Using gross margin instead of contribution margin. Gross margin subtracts only product cost. In the example, 65% gross margin gives a breakeven of 1.54; the real one is 2.20. A campaign at 1.80 looks profitable and loses $8.06 per order ($80 ÷ 1.80 = $44.44 of ads against $36.38 of contribution). Even Shopify’s breakeven ROAS guide labels its denominator “gross profit margin” while subtracting all variable costs, so check what a calculator means by margin.
- Leaving out returns, payment fees and shipping. In the example these add $12.62 per order. Dropping them raises the margin from 45.5% to 61.25% and lowers breakeven from 2.20 to 1.63.
- Comparing against platform-attributed revenue. Breakeven is calculated on revenue you keep. Compare it with ROAS on realized store revenue, or you’ll judge campaigns on sales the platform claimed but the store didn’t keep.
- Including sales tax, VAT or shipping charges in revenue. If the conversion value includes them and your margin doesn’t, ROAS looks higher than the margin can support.
- Ignoring first order vs lifetime value. Breakeven on the first order is strict. A subscription brand may accept a first-order ROAS below breakeven if repeat purchases pay it back, but only with measured repeat rates, not hoped-for ones.
- Using one store-wide number. A 2.20 average can hide a product line that needs 5.00.
Published benchmarks don’t fix any of this. Shopify’s August 2026 roundup of ROAS benchmarks draws on vendor reports, and the sources it cites don’t state their sample sizes; the figures are platform-reported averages that know nothing about your margin.
What to do now
- Build your contribution margin. Use the spreadsheet above with 90 days of order and cost data, or a contribution margin bridge from your connected store.
- Set breakeven and target ROAS per product group. Enter the target in Google Ads as a percentage and use the same floor for Meta.
- Measure ROAS on realized revenue. Compare platform-attributed revenue with store orders after refunds, for example with Meta Attribution Reality.
- Track contribution, not only revenue. Watch CM2 and CM3 ROAS or POAS weekly, and see which cost lines move in a cost mix view.
- Split new and returning customers. Track new-customer CAC against first-order contribution and repeat rates.
- Write down your definitions. Agree on one formula each for MER and POAS before anyone sets a target on them.
AmICited is our product. Its Profit-true ROAS report shows revenue ROAS, CM2 ROAS and CM3 ROAS for Meta spend on realized revenue, and marks CM2 and CM3 unavailable when product or order costs are missing instead of falling back to revenue. Its limits: it needs a connected Meta Ads account and a connected store ( Shopify, WooCommerce, Magento 2, Shoptet or BiznisWeb), ad and store integrations start on the Pro plan, CM3 is contribution after advertising rather than company profit after overhead, and it describes observed economics, not incremental lift.
The takeaway
Breakeven ROAS is 1 ÷ contribution margin, and it’s only as good as its two inputs. Build the margin from every variable cost, compare it with revenue your store actually kept, and use platform ROAS for tuning campaigns rather than for deciding whether ads pay. When the platform says 3.50, blended ROAS says 3.33 and new-customer ROAS says 1.60, all three can be right; they just answer different questions.
 LinkedIn