


Reports Hub for Domain Data
The Reports hub is the seo reporting dashboard that lists every report AmICited can run for a domain — traffic, opportunities, earnings, costs, products, customers, markets and operations — each card showing a live number, a trend and what it needs before it can answer.
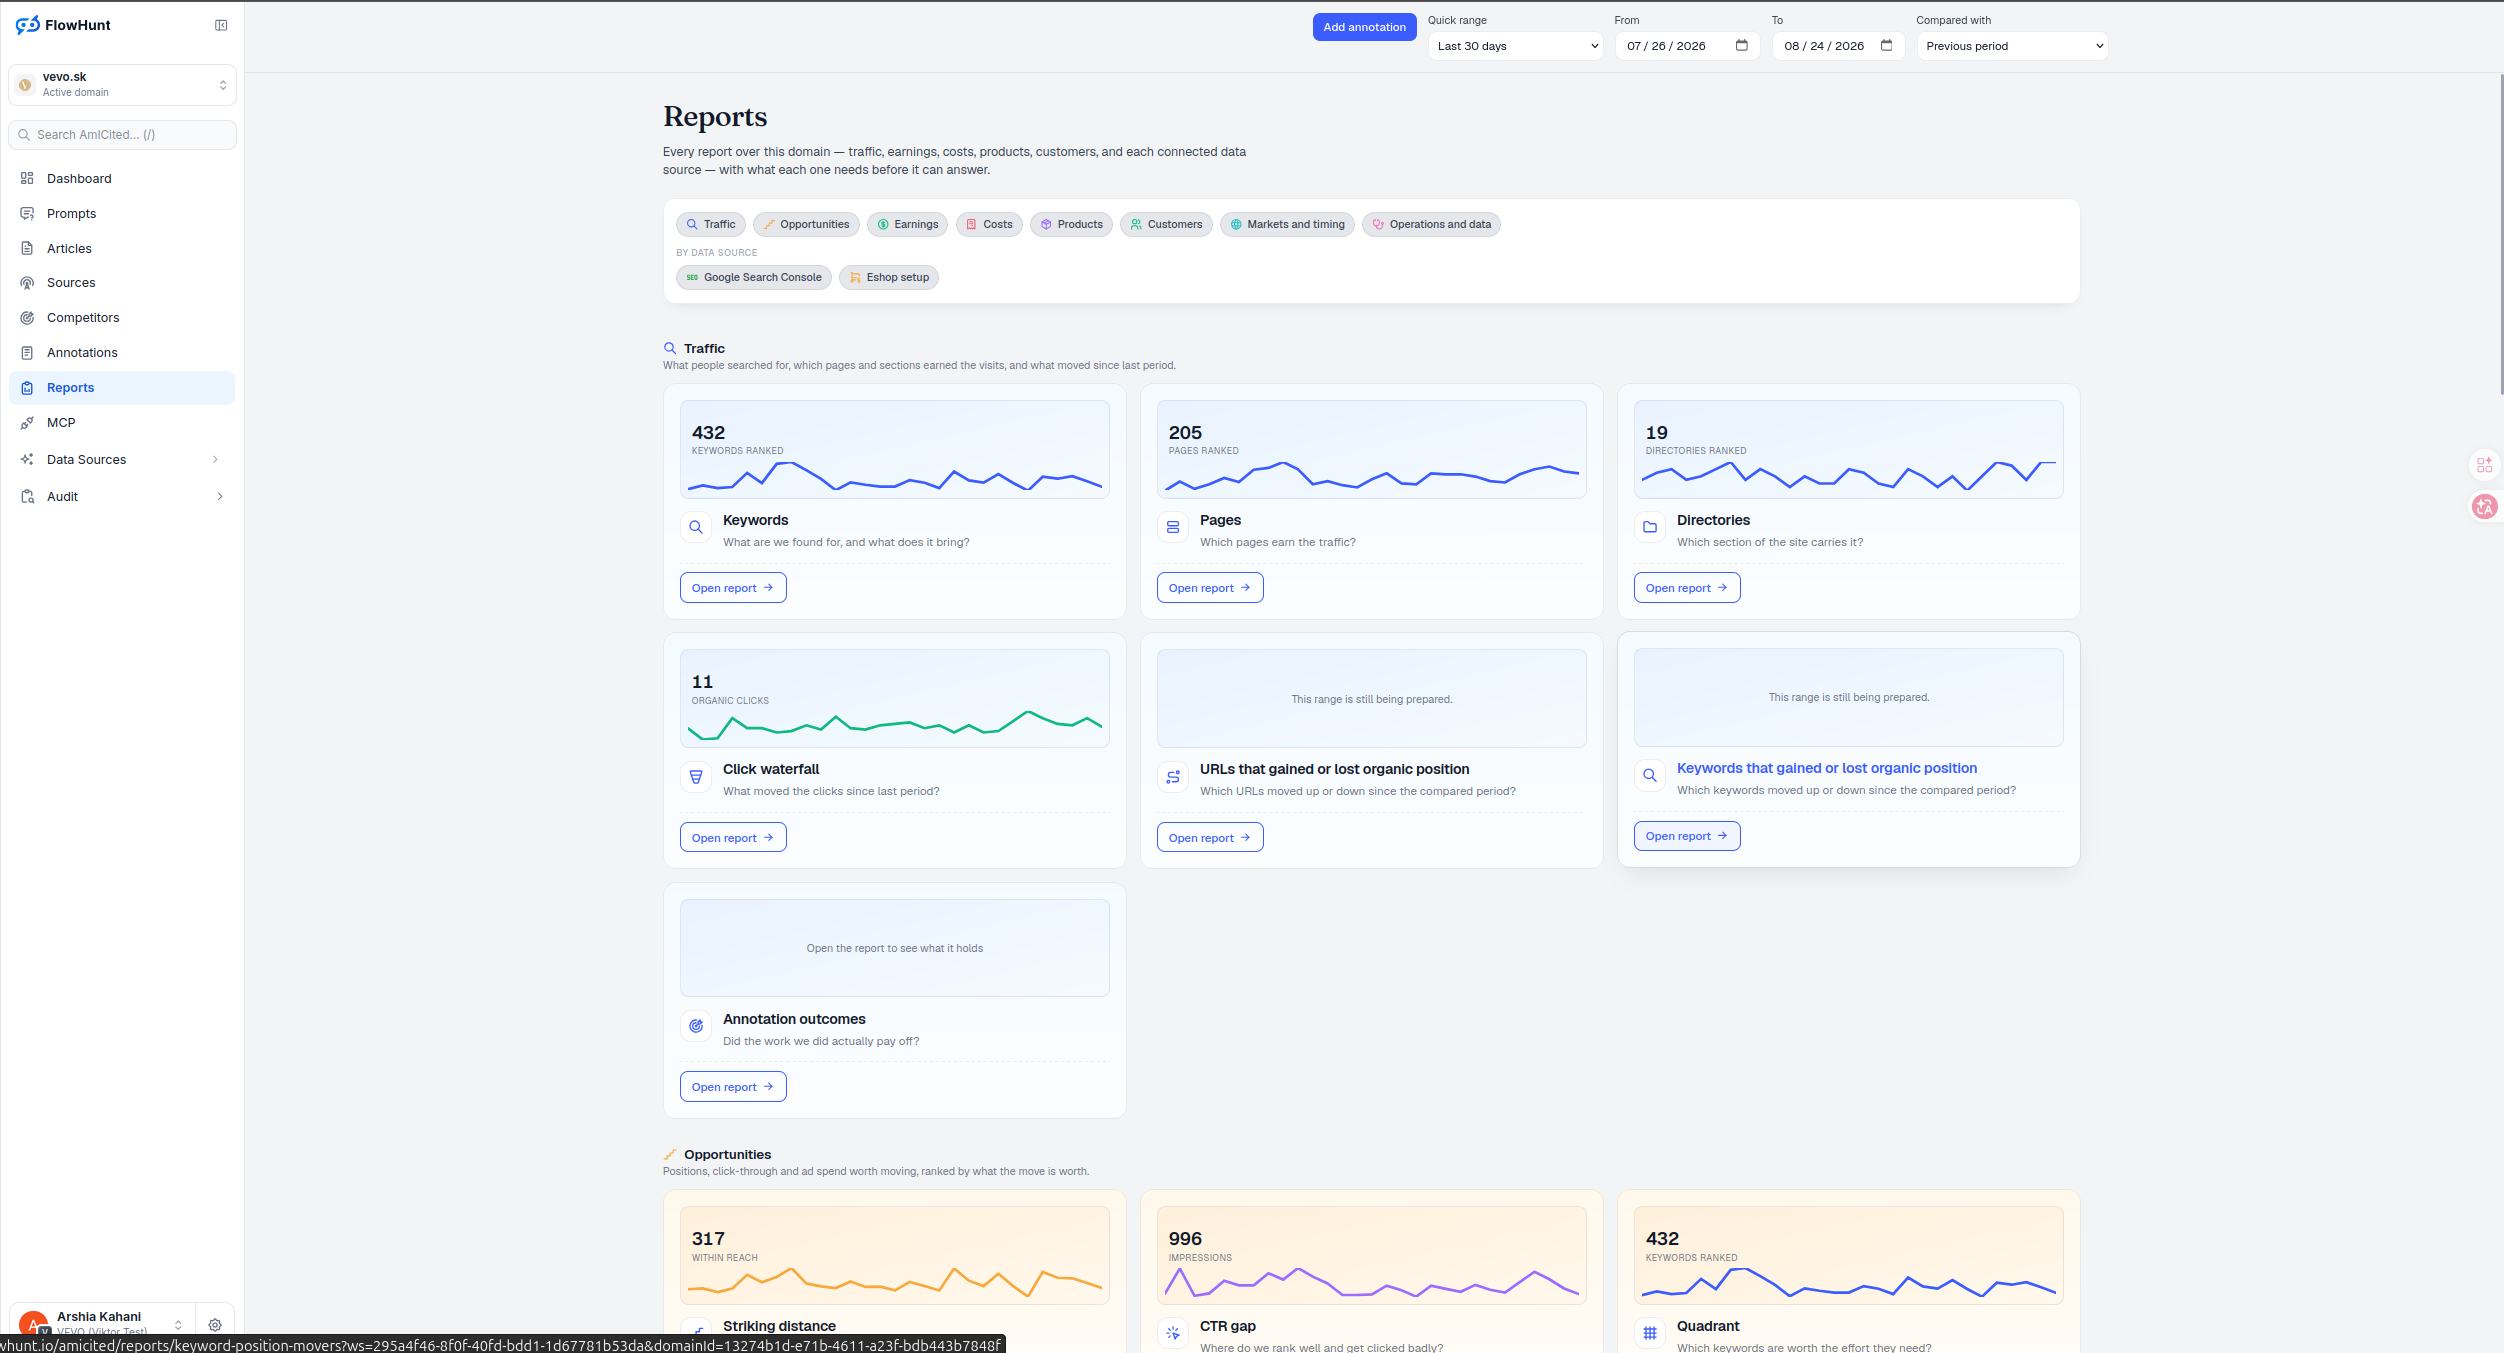
Reports by Data Source
As seo dashboard software, every report sits in one category and can also be filtered by which connected data source powers it — Google Search Console, an Eshop connection, or any other source on Data Sources. A card that needs a connection you don’t have yet tells you exactly which one, instead of rendering an empty chart.
- Eight categories — Traffic, Opportunities, Earnings, Costs, Products, Customers, Markets and timing, and Operations and data.
- Filter by data source — narrow the whole hub to only the reports powered by Google Search Console, an Eshop connection, or any other source you’ve connected.
- Live sparkline per card — every report card shows its own key number and a trend line before you ever open it.
- Honest empty states — a card missing a required connection says exactly which one to add, instead of quietly showing nothing.
- Estimated is not missing — a card running on an assumption, like unmapped product costs, still opens the real report but also offers a fix link, distinct from a card that can’t open at all.
- Add annotation, from any card — log the work you’re about to do right where you’re looking at the metric it should move.
- Compared with, set globally — one date range and comparison period applies across every report you open from the hub.
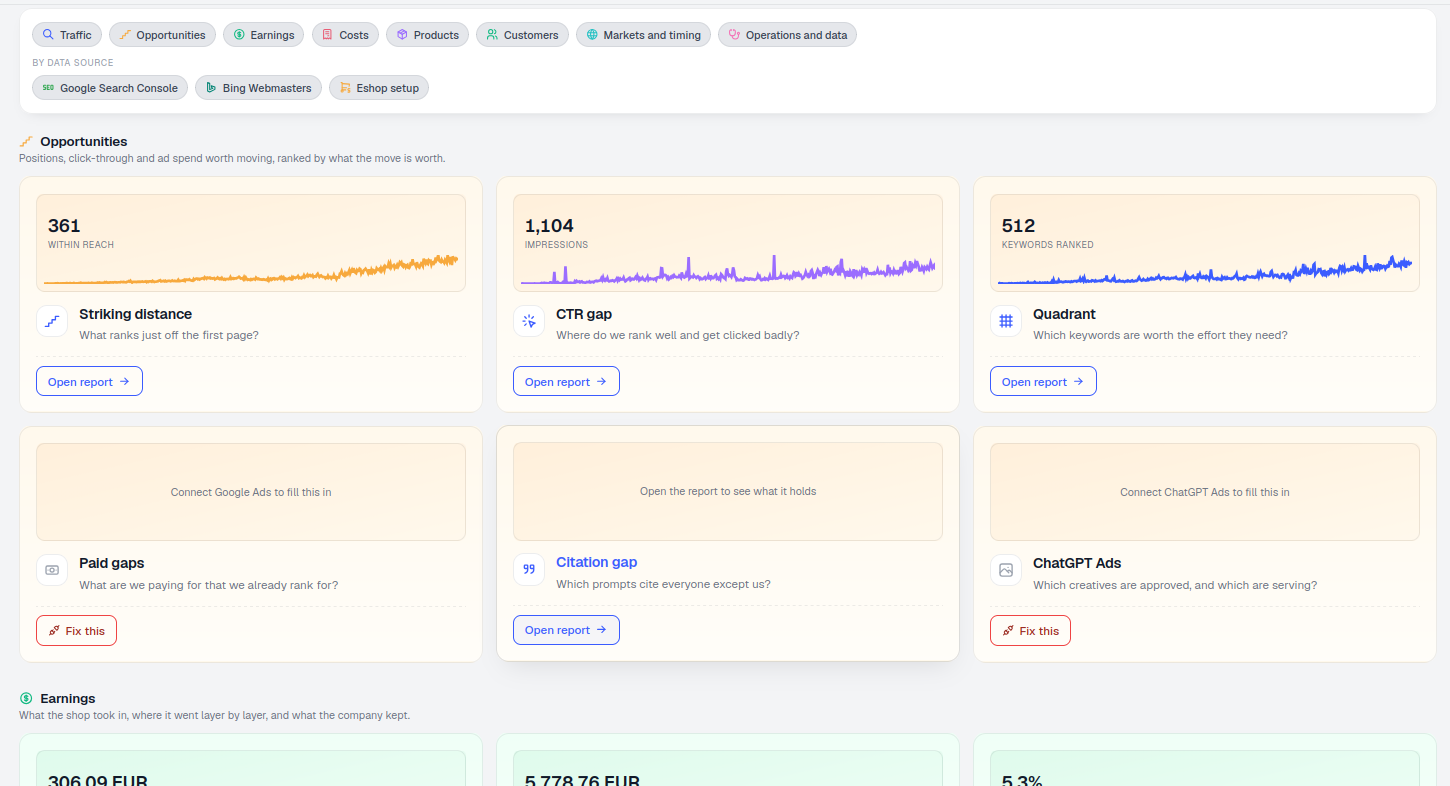
Reports Hub Categories
Traffic, Opportunities, Earnings, Costs, Products, Customers, Markets and timing, and Operations and data — the hub’s cards open straight into Unified Keywords, Organic vs Paid Pages, Directory View, Click Waterfall, the Position Movers reports, Annotation Outcomes, Striking Distance, CTR Gap, the Organic Rank Report and more, without you needing to know a report’s name in advance to find it. The Traffic row also includes Query Coverage , N-Grams , Index Bloat , Decay & Growth , Cannibalization Detection , and Content Changes . A sticky quick-navigation panel lists every category as a chip so jumping between them never means scrolling back to the top, and each card states the question it answers — ‘What moved traffic?’, ‘What did the shop keep?’ — not just a dataset name.
- Traffic — Keywords, Query Coverage, N-Grams, Pages, Directories, Index Bloat, Organic clicks, Click Waterfall, Decay & Growth, Position Movers, Cannibalization Detection, Content Changes, Annotation Outcomes.
- Opportunities — Striking distance, CTR gap, the Organic Rank Report, Paid gaps, Citation gap, ChatGPT Ads.
- Earnings, Costs, Products, Customers — the ecommerce side, once an Eshop connection is live.
- Markets and timing, Operations and data — everything else the domain needs tracked, in its own row.
- Permission-aware by design — categories a role can’t open are removed entirely, not shown as dead links.
Filter Reports by Data Source
The BY DATA SOURCE filter row narrows every category on the page to only the reports a specific connection powers — pick Google Search Console to see everything organic search feeds, or your Eshop connection to see everything tied to orders and revenue. Add annotation sits right there too, so logging the work you’re about to do happens where you’re already looking at the metric it should move. Below-the-fold grids only fire their preview requests once you scroll near them, and a headline number is always the latest reported day, not a total across the window — the sparkline is what shows the shape of that window. Ecommerce dates clamp to actual shop coverage, and those cards intentionally skip comparison since they show a level, not a delta.
- One filter, every category — narrows Traffic, Opportunities, Earnings and the rest at once, not one at a time.
- See a connection’s full impact — exactly which reports go quiet if you disconnected this source today.
- Add annotation, in context — log the work right where you’re looking at the metric it should move.
- No hidden dependencies — a card’s data source is never a mystery you have to infer from its numbers.
- Headline is a day, not a sum — the big number on a card is the latest daily value; the sparkline carries the trend.
categories, one screen, no digging for the right report
Traffic, Opportunities, Earnings, Costs, Products, Customers, Markets and timing, and Operations and data — every report AmICited runs sits in exactly one of these, findable without knowing its name in advance.
See Data SourcesBrowse All Domain Reports
Traffic, Opportunities, Earnings and five more categories — each card live with a real number, a trend, and what it needs before it can answer.
Ready to see every report over your domain?
Free check · 7-day trial · card required