


How to See Visibility by AI Platform
Compare your AI citations across ChatGPT, Gemini, Perplexity and Google AI in the AmICited platform breakdown.

Your overall Visibility Score is an average, and averages hide as much as they reveal.
Quick Steps
- The per-platform breakdown sits beside your Visibility Score gauge at the top of the Dashboard.
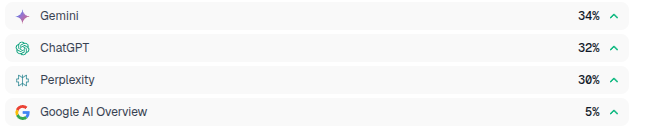
- It shows each engine’s share of your tracked citations, e.g. Gemini 34%, ChatGPT 32%, Perplexity 30%, Google AI Overview 5%.
- A low score on one engine often points to a specific, fixable content or structure gap, not a general weakness.
- Use the All AI Models filter to switch the whole dashboard to a single engine and diagnose the gap directly.
- Track the trend on a regular cadence rather than reacting to a single day’s snapshot.
What is AI visibility by platform?
AI visibility is the measure of how often, and how prominently, a brand gets cited in the answers generated by AI assistants (ChatGPT, Gemini, Perplexity, and Google AI Overviews chief among them). Unlike traditional SEO, where “ranking” means holding a position on a single results page that every searcher sees roughly the same way, AI visibility is inherently fragmented: each engine runs its own retrieval pipeline, trains on different data, and applies its own rules for which sources it trusts enough to cite. A brand that dominates one engine can be nearly invisible on another, because the two systems are, in effect, running separate elections with separate voters.
This is why looking at visibility “by platform” matters as much as looking at the blended number. A single AI visibility score tells you the average outcome of your brand’s citation performance across every tracked engine, but it can’t tell you where that performance is coming from. Two brands could each show a 30% blended score and be in completely different positions strategically: one earning a steady 30% on every engine, the other earning 90% on one engine and 0% everywhere else. The second brand is one model update away from losing most of its visibility overnight; the first is diversified and resilient. You can’t tell the difference without breaking the number apart by engine.
The underlying cause of this divergence is that each AI platform has different preferences for source format, authority signals, and content structure, a phenomenon closely related to what’s sometimes called the 7% overlap problem : the sources that rank well in traditional Google search and the sources that get cited by generative AI engines overlap far less than most marketers assume. Gemini, for instance, draws heavily on Google’s own index and tends to favor pages with strong structured data and topical authority. ChatGPT leans on a mix of its training corpus and live browsing, and often favors well-organized, quotable prose. Perplexity is real-time and citation-heavy by design, rewarding fresh, clearly-sourced content. Google AI Overview sits closest to classic search ranking factors but adds its own summarization layer on top. None of these engines behave identically, so a strategy tuned for only one of them will systematically underperform on the others.
This is also the foundation of generative engine optimization (GEO) as a discipline: instead of optimizing for one search algorithm, you’re optimizing for several distinct retrieval-and-generation systems at once, each with its own idea of what counts as a good, citable source. Reading your visibility broken out by platform is how you find out which of those systems already trust you, and which ones still need work.
Where to find it
The per-platform breakdown sits directly beside the Visibility Score gauge at the top of the Dashboard in AmICited, as a short ranked list of AI engines with a percentage next to each one. In the example shown above: Gemini 34%, ChatGPT 32%, Perplexity 30%, Google AI Overview 5%. Because it’s placed right next to the headline gauge, it’s designed to be the very first thing you check after your overall score. The immediate follow-up question to “how visible am I?” is always “visible on what, exactly?”
The breakdown updates on the same cadence as the rest of your dashboard, so as AmICited runs your tracked prompts across each engine and logs new citations , the percentages shift to reflect the latest data. You don’t need to navigate anywhere else to see it; it’s part of the default dashboard view for every tracked domain.
What it shows
Each percentage is that engine’s share of your tracked citations, in other words, where your visibility is coming from. A high number next to Gemini means Gemini is doing most of the work of surfacing your brand across your tracked prompts; a low number next to Google AI Overview means you’re barely present there, even if your blended score looks respectable.
This is a per-engine distribution, not a set of independent scores that happen to sum to something meaningful. It’s specifically designed to show you the shape of your visibility, not just its size. The strengths and weaknesses jump out immediately: you can be a strong, frequently-cited source on one engine and nearly absent on another, even though your single blended Visibility Score looks middling. Without this view, that imbalance would be invisible: a 25% blended average looks the same on paper whether it’s spread evenly or concentrated entirely in one engine.
The breakdown is also the fastest way to sanity-check your overall AI rank tracker data before digging into individual prompts or sources. If one engine’s share collapses suddenly, that’s usually the first sign of either a model update on that platform’s side or a real regression in how your content is being retrieved, and it tells you exactly where to start investigating rather than making you comb through every tracked prompt individually.
How to use it
- Find your weak engine. The lowest bar is where you have the most room to grow. Different engines favor different source types, so a low score often points to a specific, fixable gap: for example, an engine that leans on structured data may simply not have enough schema-marked pages to draw from, while one that favors fresh, well-sourced writing may be missing recently updated content from your site.
- Confirm with the filter. Switch the All AI Models filter at the top of the page to a single engine to see the rest of the dashboard (your prompts, your sources, your competitors) through that engine’s lens specifically. This turns the high-level percentage into a concrete, investigable list of what that one engine is and isn’t citing.
- Diagnose the gap, don’t just note it. Once you’ve isolated the weak engine, look at what it’s citing instead of you. If competitors are showing up with more structured, directly quotable answers, that’s a content-formatting problem you can fix; see how to structure content so AI models can actually cite it for a practical framework. If the weak engine is citing sources you don’t control at all (forums, review sites, third-party listings), that’s a source-diversity problem rather than a content problem, and the fix looks different.
- Don’t over-rotate on one engine. If your visibility is lopsided toward a single platform, you’re exposed to that engine’s model changes. A single algorithm update on your strongest engine could wipe out most of your visibility overnight. Aim to build presence across all of them, treating the per-platform breakdown as an ongoing balance sheet rather than a one-time diagnosis.
- Track the trend, not just the snapshot. A single day’s percentages are a snapshot; what matters more is whether your weakest engine is closing the gap over time. Revisit the breakdown on a regular cadence (weekly or biweekly is typical) so you can tell whether your fixes are actually moving the needle on that specific engine, rather than just watching the blended score drift.
For a fuller version of this split, with exact percentages and trend arrows, see the By platform widget lower on the dashboard. It’s worth pairing this per-platform view with your share of voice numbers too: visibility tells you whether you’re being cited at all on a given engine, while share of voice tells you how you stack up against competitors on that same engine, which is often the more actionable number when you’re deciding where to invest next.
Treating each AI engine as its own channel, rather than folding everything into one blended score, is the difference between reacting to visibility problems after they’ve already cost you citations and catching them while they’re still isolated to a single platform. If you’re building out a broader monitoring routine, it’s worth reading up on how to track your AI visibility score in ChatGPT search specifically, since ChatGPT’s retrieval behavior differs enough from Gemini’s or Perplexity’s that it deserves its own diagnostic pass. And if your visibility is currently concentrated on one or two engines rather than spread across all of them, that’s the exact scenario AmICited’s AI visibility dashboard is built to surface early, before a single platform’s model update becomes a brand-wide visibility problem.
Frequently asked questions
It sits directly beside your Visibility Score gauge at the top of the Dashboard, as a short ranked list of engines with a percentage next to each, for example Gemini 34%, ChatGPT 32%, Perplexity 30%, Google AI Overview 5%. It updates on the same cadence as the rest of your dashboard.
A single blended score is an average, and averages hide where the performance actually comes from. Two brands can share the same 30% blended score while one earns it evenly across every engine and the other earns 90% on a single engine and 0% elsewhere, a much riskier position that only the per-platform breakdown reveals.
Treat your lowest-scoring engine as your fastest win, since different engines favor different source formats and structures. Switch the All AI Models filter to that single engine to see your prompts and sources through its lens, then look at what it's citing instead of you to diagnose whether it's a content-formatting or a source-diversity problem.
Each engine runs its own retrieval pipeline and trains on different data. Gemini favors pages with strong structured data and topical authority from Google's index, ChatGPT favors well-organized, quotable prose, Perplexity rewards fresh, clearly-sourced content, and Google AI Overview sits closest to classic search ranking factors.
More tutorials in this section
 How to Read Your Visibility Score
Learn what the AmICited Visibility Score measures and how its gauge and platform breakdown show your AI …
Read guide →
How to Read Your Visibility Score
Learn what the AmICited Visibility Score measures and how its gauge and platform breakdown show your AI …
Read guide →
 How to See Your Share of Voice
Find your AmICited Share of Voice and learn how it compares with your Visibility Score.
Read guide →
How to See Your Share of Voice
Find your AmICited Share of Voice and learn how it compares with your Visibility Score.
Read guide →
 How to Use the Domain Semantic Map
Explore the AmICited Domain Semantic Map to find clusters and topic gaps across prompts, fan-out queries and …
Read guide →
How to Use the Domain Semantic Map
Explore the AmICited Domain Semantic Map to find clusters and topic gaps across prompts, fan-out queries and …
Read guide →Ready to put it into practice?
Free check · 7-day trial · card required