


How to Read Your Visibility Score
Learn what the AmICited Visibility Score measures and how its gauge and platform breakdown show your AI visibility.

Your Visibility Score is the headline metric on the AmICited dashboard. It answers one question in a single number: when people ask AI assistants about topics in your space, how often does your brand actually show up?
At a Glance
- The Visibility Score gauge sits at the top of the Dashboard, showing your citation rate as a percentage.
- It’s the share of your monitored prompts where your brand appears in the AI answer, across tracked engines.
- A per-engine breakdown below the gauge shows where you’re strong (e.g. Gemini) and where you’re lagging.
- Judge it by its multi-week trend, not any single day, since AI answers vary from run to run.
- The filter bar (AI model, country, tags, date range) rescopes the whole score, so compare like for like.
What is an AI visibility score?
An AI visibility score is a percentage that tells you how often your brand appears in answers generated by AI assistants like ChatGPT, Perplexity, Gemini and Google AI Overviews, out of all the questions (“prompts”) you’re tracking in your niche. It’s the AI-era equivalent of a keyword ranking report, except instead of measuring where a URL lands on a results page, it measures whether an AI-generated answer mentions your brand at all, and whether it backs that mention with a link back to your site.
The underlying discipline is often called generative engine optimization (GEO): the practice of shaping content, structure and third-party signals so that generative AI systems are more likely to surface and cite your brand when they answer a relevant question. Traditional SEO optimizes for a ranked list of blue links; GEO optimizes for inclusion inside a synthesized answer, where there is no fixed number of “slots” and no guarantee your competitor’s absence means your presence. A visibility score exists because that shift needed its own metric: one that captures presence in an answer rather than position on a page.
Every time an AI assistant answers a question and names, describes, or links to your brand, that’s an AI citation . Citations can be as explicit as a hyperlink in a ChatGPT response with sources, or as implicit as your brand name appearing in a Google AI Overviews summary with no link at all. A visibility score aggregates citations across every prompt and engine you monitor into one comparable number, so you can track the trend the same way you’d track organic traffic or keyword rankings, without manually re-running dozens of prompts across four different chat interfaces every week.
This matters because AI assistants are increasingly the first (and sometimes only) research step for buyers. If your brand is invisible in the answers people get when they ask “best tools for X” or “how does Y work,” you’re losing consideration before a human ever reaches your website. The visibility score is the single number that tells you, at a glance, whether that’s happening, and whether it’s getting better or worse.
Where to find it
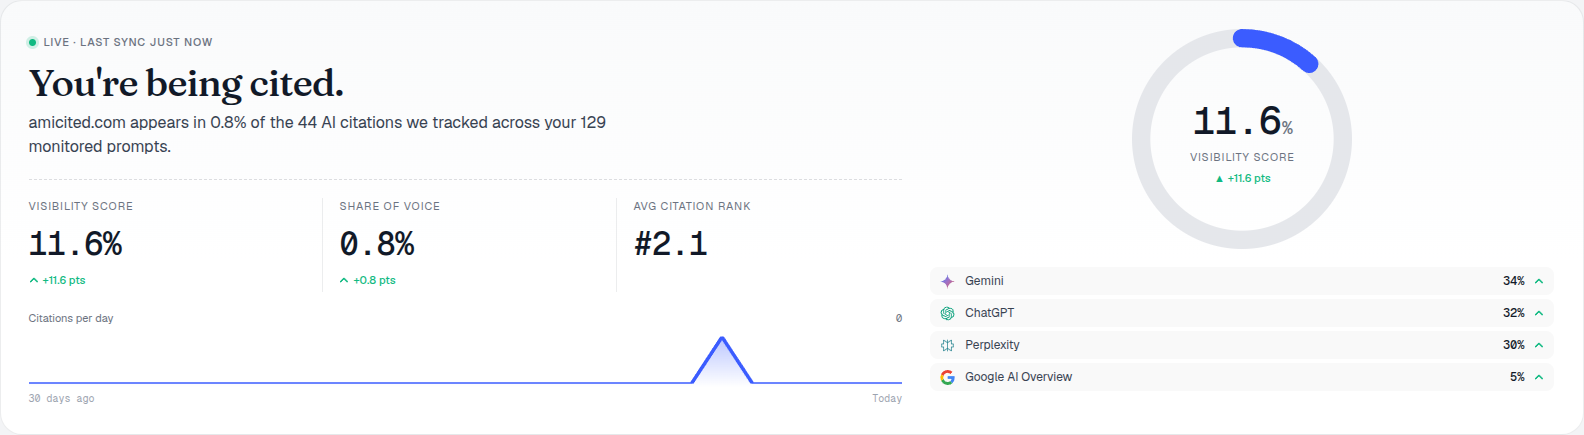
It’s the first thing you see when you open the Dashboard. The big circular gauge on the right shows your Visibility Score as a percentage (in the example above, 11.6%), with the change versus the previous period underneath it (▲ +11.6 pts). The same figure is repeated as the first of the three headline stats on the left, next to Share of Voice and Avg Citation Rank.
The headline sentence right below the title spells out what the number is built from: “amicited.com appears in 0.8% of the 44 AI citations we tracked across your 129 monitored prompts.” The green LIVE · LAST SYNC label above the title tells you how fresh the data is.
Everything on this part of the dashboard is built around your monitored prompt set: the list of real-world questions you’ve told AmICited to track. If you haven’t yet built that list out, or want a framework for deciding which questions actually move the needle, it’s worth reading up on how to find which prompts trigger AI brand mentions before you spend too much time interpreting a score built on a thin or unrepresentative set of questions.
What it measures
The Visibility Score is the share of your monitored prompts where your brand appears in the AI answer, across the AI engines AmICited tracks. Every prompt you track is run against each engine on its schedule; for each response, AmICited checks whether your brand shows up; the score is the proportion of those responses where you do, as a percentage.
A score of 100% would mean you appear in every answer to every prompt you track; 0% means you’re currently invisible for those questions. In practice, most brands sit somewhere in a wide middle range that depends heavily on category competitiveness, prompt breadth, and how established the brand already is in the training and retrieval data these models draw on.
The list under the gauge breaks the score down by AI engine (for example Gemini 34%, ChatGPT 32%, Perplexity 30%, Google AI Overview 5%), so you can see which engines are driving your visibility and which are lagging. This per-engine view exists because the score is really an aggregate: it’s easy to read “11.6%” as one flat number and miss that you might be strong in one engine and nearly absent in another. AmICited functions as an AI rank tracker across all four engines simultaneously, so you don’t have to run the same prompt manually in four different chat windows to get this breakdown.
How to read it
- The number itself tells you your current standing. There’s no universal “good”: it depends on how competitive and broad your tracked prompts are. A tight set of high-intent prompts will usually score higher than a broad set of category questions.
- The trend (
+11.6 pts) matters more than the absolute. Watch the direction over weeks, not the exact figure on any single day. AI answers vary between runs, so day-to-day movement is normal. - The per-engine split shows where to focus. It’s common to rank well in one engine and be nearly absent in another: the breakdown tells you which one to work on.
- It’s a leading indicator, not a vanity metric. Because AI-generated answers increasingly shape what a prospect believes about your category before they visit any website, a rising Visibility Score is one of the earliest signals that your content, structure and third-party mentions are working, often weeks before it shows up in organic traffic.
If you want a deeper, formula-level explanation of how a score like this gets calculated behind the scenes (including how multi-run sampling and citation weighting typically work), how an AI visibility score is calculated walks through the mechanics in more detail than fits here.
Everything here respects your filters
The bar at the top of the page (All AI Models, All countries, All tags, and the date range, Last 30 days) rescopes the whole dashboard, including the Visibility Score. So the number always reflects what you’ve selected. When you compare scores, change one filter at a time: switching to a single engine or a shorter date range will move the number, and that’s expected.
This filtering matters more than it might seem. A brand that only sells in one country but tracks prompts globally will see an artificially diluted score unless it filters by country; an agency managing multiple clients from one workspace needs the tag filter to keep each client’s number honest, which is one reason agencies running AI visibility for agencies across a client portfolio tend to lean on per-client workspaces rather than one shared prompt set. Treat the filter bar as part of reading the score correctly, not just a display preference.
How to use it
- Set a baseline. Note your score right after you finish adding prompts. That’s your starting point.
- Segment by engine. Use the All AI Models filter (or read the per-engine list under the gauge) to see where you’re strong and where you’re missing.
- Tie changes to actions. After you publish new content or generate articles in AmICited, watch whether the score climbs on the prompts those pieces target.
- Pair it with Share of Voice. Visibility tells you whether you appear; Share of Voice tells you how much of the conversation you own versus competitors. Read them together: a brand can have a healthy Visibility Score while still losing ground on Share of Voice if a competitor is cited more often within the same prompts.
- Report on it consistently. If you’re running this for a client or reporting up internally, pull the score on the same cadence and filter settings each time. A dashboard is only useful as a trend line if the comparison basis stays consistent.
Where the score fits alongside your other metrics
The Visibility Score sits at the top of a broader AI visibility dashboard precisely because it’s meant to be the entry point, not the whole story. Below the gauge, the prompt-level table shows you exactly which questions you’re winning and losing on; the sources panel shows which third-party pages the AI engines are pulling citations from; and the competitor view shows who’s showing up instead of you when you don’t appear. None of those views replace the headline score: they explain why it’s moving.
That layered structure mirrors how most teams should actually operationalize AI search visibility: use the top-line score for reporting and trend-spotting, and use the supporting panels for the diagnostic work of figuring out what to fix. If your prompt set is still thin, that’s usually the first thing worth expanding, since a Visibility Score calculated over ten narrow prompts tells you far less than one calculated over a hundred prompts that actually reflect how your buyers search.
Treat the Visibility Score as your north-star trend line. The prompts, sources and competitor views further down the dashboard explain why it moves: the score itself tells you whether you’re winning or losing ground in AI answers. Once you’re comfortable reading it, the natural next step is closing the gaps it exposes: pairing this dashboard with AmICited’s SEO agents to turn the prompts where you’re currently absent into published, AI-citable pages, so the next time you check the gauge, the movement you see is the direct result of work you can point to.
Frequently asked questions
It's the share of your monitored prompts where your brand appears in the AI answer, across the AI engines AmICited tracks (ChatGPT, Perplexity, Gemini and Google AI Overviews). Every tracked prompt is run against each engine on schedule, AmICited checks whether your brand shows up in each response, and the score is the proportion where it does, as a percentage.
Not on its own. There's no universal "good" number: it depends heavily on how competitive and broad your tracked prompts are. A tight set of high-intent prompts will usually score higher than a broad set of category questions, so judge the number in context and focus on its multi-week trend rather than treating any single figure as a verdict.
Each engine retrieves, weighs and cites sources differently, so it's common to rank well in one and be nearly absent in another. The per-engine breakdown below the gauge (e.g. Gemini 34%, ChatGPT 32%, Perplexity 30%, Google AI Overview 5%) shows exactly which engines are driving your score and which one deserves attention.
Visibility Score tells you whether you appear at all in answers to your monitored prompts. Share of Voice tells you how much of the AI-citation conversation you own relative to competitors within those same prompts. A brand can have a healthy Visibility Score while still losing ground on Share of Voice if a competitor is cited even more often on the same questions.
More tutorials in this section
 How to See Your Share of Voice
Find your AmICited Share of Voice and learn how it compares with your Visibility Score.
Read guide →
How to See Your Share of Voice
Find your AmICited Share of Voice and learn how it compares with your Visibility Score.
Read guide →
 How to Use the Domain Semantic Map
Explore the AmICited Domain Semantic Map to find clusters and topic gaps across prompts, fan-out queries and …
Read guide →
How to Use the Domain Semantic Map
Explore the AmICited Domain Semantic Map to find clusters and topic gaps across prompts, fan-out queries and …
Read guide →
 How to See Visibility by AI Platform
Compare your AI citations across ChatGPT, Gemini, Perplexity and Google AI in the AmICited platform …
Read guide →
How to See Visibility by AI Platform
Compare your AI citations across ChatGPT, Gemini, Perplexity and Google AI in the AmICited platform …
Read guide →Ready to put it into practice?
Free check · 7-day trial · card required