


How to See Brand Voice Across All Prompts
Use the Brand Voice chart on the AmICited Prompts page to compare your share of AI mentions with competitors.

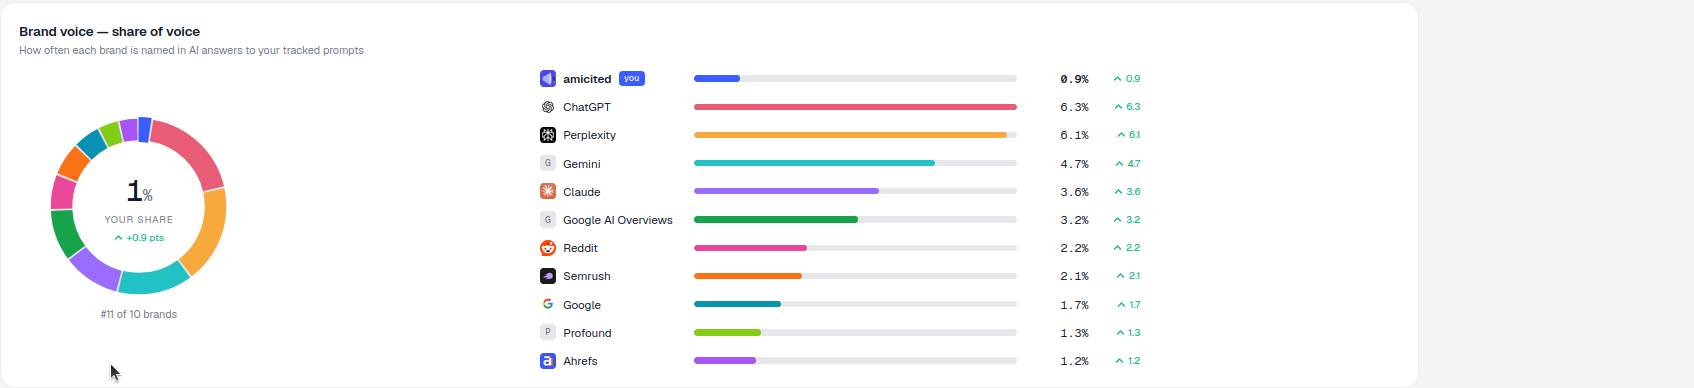
The Brand voice (share of voice) chart shows how much of the AI conversation your brand owns across all your tracked prompts at once: your slice, and every competitor’s, in one donut.
Quick Steps
- Find the donut chart on the Prompts page, between the overview stats and the Tracked prompts table.
- The center shows your overall share and rank among all named brands; the ranked list breaks it out brand by brand.
- Scan the list to find who’s ranked above you, then pick the nearest one as your next target to overtake.
- Track the trend over a regular cadence and cross-reference with individual prompts to see where you’re winning or losing.
- Remember it measures how often you’re named, not sentiment or accuracy, so treat it as a starting point, not the full picture.
What is share of voice in AI search?
Share of voice is the percentage of all brand mentions in a given set of answers that belong to you, rather than to a competitor. The concept isn’t new: media and paid-search teams have used it for decades to measure competitive presence in impressions, ad spend, or search rankings. What’s changed is where the mentions now happen: instead of counting appearances in search results or news coverage, AI share of voice counts how often your brand’s name is spoken by ChatGPT, Gemini, Perplexity, Claude, and Google AI Overviews when they answer the questions your buyers actually ask.
The mechanic behind it is a citation : the moment an AI model names a specific brand, product, or source while generating a response. Every time a model answers a prompt like “what’s the best project management tool for remote teams,” it may cite zero, one, or several brands. Add up every citation across every tracked prompt, group them by brand, and you get a distribution: your brand’s citations divided by total citations in the set is your share of voice. This is the foundational metric of generative engine optimization (GEO): the practice of earning visibility inside AI-generated answers the same way SEO earns visibility in a search results page.
Why does this matter more than a simple “were we mentioned, yes or no” check? Because AI answers are zero-sum in a way traditional search results aren’t. A search results page can show ten blue links; a conversational AI answer typically names only a handful of brands before moving on. If a competitor is named in an answer and you aren’t, you haven’t just missed an opportunity, you’ve effectively ceded that share to them. Tracking share of voice across your whole prompt set, rather than prompt by prompt, tells you whether you’re gaining or losing ground in the AI-driven buying journey as a whole, and exactly which brands are eating your share.
Where to find it
It sits between the overview stats and the Tracked prompts table on the Prompts page, subtitled “How often each brand is named in AI answers to your tracked prompts.” Because it lives on the Prompts page rather than the main dashboard, it’s scoped specifically to the prompt set you’re currently tracking, so if you’ve built separate prompt groups for different products, regions, or campaigns, the donut reflects whichever set you’re viewing at the time.
What it shows
- The donut shows your share in the center (e.g.
1% · YOUR SHARE) with the change versus the previous period (▲ +0.9 pts) and your rank among all named brands (e.g.#11 of 10 brands). The percentage-point change matters as much as the raw number: a small share that’s climbing is a healthier signal than a larger share that’s flat or shrinking, because it tells you the trend line is moving in your favor. - The ranked list on the right breaks the whole pie out brand by brand, each with a bar, a percentage and a trend arrow, your own domain flagged with the you badge, then competitors like ChatGPT 6.3%, Perplexity 6.1%, Gemini 4.7%, Claude 3.6%, and so on. Note that the “competitors” named here aren’t necessarily the companies you’d list as direct rivals in a sales deck. AI models frequently cite platforms, marketplaces, review sites, and even other AI tools as part of their answers. Seeing who actually shows up is often more revealing than assuming who will.
How is this different from Share of Voice on the dashboard?
It’s the same idea, your slice of all citations, but scoped to the Prompts view and framed as “how often each brand is named.” It’s the place to study the named-brand competition specifically, across your entire prompt set, rather than a single aggregate number sitting alongside your other top-level KPIs. If the dashboard’s share-of-voice figure is your headline number for board reporting, the Prompts-page donut is where you go to understand the composition behind that number: which brands, in what order, and by how much.
What it measures, and what it doesn’t
The donut measures relative presence, not sentiment or accuracy. A brand can rank highly in share of voice while being described neutrally, critically, or even inaccurately by the AI model. The chart tells you how often you’re named, not how well. If you want to understand the tone and context of your mentions, that’s a separate layer of analysis on top of this view; treat the donut as your starting point for “are we even in the conversation,” and dig into individual prompt answers when you need to know “and what did it actually say about us.” It also only reflects the prompts you’re currently tracking, so the accuracy of this chart is only as good as the breadth of your prompt set: a narrow set of five prompts will give you a noisier, less representative picture than a set covering the full range of ways buyers describe their problem.
How to use it
- Find who’s above you. Every brand ranked higher is out-earning you in AI answers. Scan the ranked list from the top down and note where your you badge sits relative to the pack. This single glance tells you whether you’re a market leader, a mid-pack contender, or effectively invisible in this category of AI answers.
- Pick a target. Choose the nearest brand above your you row and work to overtake its share. Overtaking the brand directly above you is a more achievable near-term goal than trying to leapfrog the entire list at once, and it gives you a concrete, trackable milestone for each optimization cycle.
- Track the trend. A rising center number and climbing bar mean your brand is being named more often over time. Check this on a regular cadence (weekly or monthly, depending on how fast your content and outreach efforts move) so you can connect specific changes (a new landing page, a PR push, a round of content optimization) to movement in the chart, rather than reacting to noise from a single snapshot.
- Cross-reference with individual prompts. If your overall share is flat despite effort, use the Tracked prompts table below the donut to see which specific prompts you’re winning and which you’re losing: a flat aggregate can hide real progress on some prompts offset by losses on others.
Where this fits in a bigger visibility strategy
Share of voice is a scoreboard, not a strategy on its own: it tells you the score, not how to change it. If you’re behind the brands listed above your you row, the next step is to figure out why they’re being cited and you aren’t: what’s different about their content, their site structure, their public presence, or the third-party sources feeding the model’s answer. That diagnostic work is where you’d move from this donut into a broader competitor AI visibility analysis, or use AmICited’s prompt-level data to track competitor mentions across ChatGPT and other AI search engines prompt by prompt rather than in aggregate. If your prompt set itself feels thin or you’re unsure it reflects how buyers actually phrase their questions, it’s worth revisiting which prompts are triggering AI brand mentions in the first place, since a donut built on the wrong prompts will always give you a skewed picture. And if you’re just getting your monitoring program off the ground, AmICited’s AI visibility tooling and AI rank tracker extend this same brand-vs-brand view down to individual answer positions, while teams managing this across multiple client accounts can see how the for agencies workspace keeps share-of-voice reporting separated cleanly per client. Wherever you start, the goal is the same: turn “we’re #11 of 10 brands” into a rising line on this chart, one prompt and one piece of content at a time.
Frequently asked questions
It's a donut chart showing your brand's share of voice across all your currently tracked prompts at once, with your slice in the center alongside a ranked list of every other named brand. It sits between the overview stats and the Tracked prompts table on the Prompts page.
They measure the same underlying concept, your slice of all citations, but the dashboard figure is a single headline number for the whole account, while the Prompts-page donut is scoped to whichever prompt set you're viewing and shows the full brand-by-brand composition behind that number, including rank and percentage-point change.
No. The donut measures relative presence, how often you're named, not sentiment or accuracy. A brand can rank highly in share of voice while being described neutrally, critically, or even inaccurately. Treat the donut as your starting point for whether you're in the conversation, then check individual responses to see what was actually said.
Scan the list to see which brands rank above your you-marked row, then pick the nearest one above you as your next target to overtake rather than trying to leapfrog the whole list at once. Track the trend on a regular cadence, and use the Tracked prompts table below the donut to see which specific prompts are driving or dragging your overall number.
More tutorials in this section
 How to Use the Tracked Prompts Table
Learn how to read, search and filter the AmICited Tracked Prompts table, including each prompt’s citations, …
Read guide →
How to Use the Tracked Prompts Table
Learn how to read, search and filter the AmICited Tracked Prompts table, including each prompt’s citations, …
Read guide →
 Generate AI Prompts from a URL
Let AmICited analyze a page and suggest buyer questions to track as prompts.
Read guide →
Generate AI Prompts from a URL
Let AmICited analyze a page and suggest buyer questions to track as prompts.
Read guide →
 How to Add Prompts by Pasting a List
Already have a list of questions to track? Paste them straight into AmICited, one per line.
Read guide →
How to Add Prompts by Pasting a List
Already have a list of questions to track? Paste them straight into AmICited, one per line.
Read guide →Ready to put it into practice?
Free check · 7-day trial · card required