


Ecommerce Sales Revenue and Cost Trends
Sales engine tracks revenue, orders, costs, average order value and cancellations day by day, then lays every day out again as a full daily profit and loss table — one row per day the shop traded, nothing padded, nothing hidden in a stack.
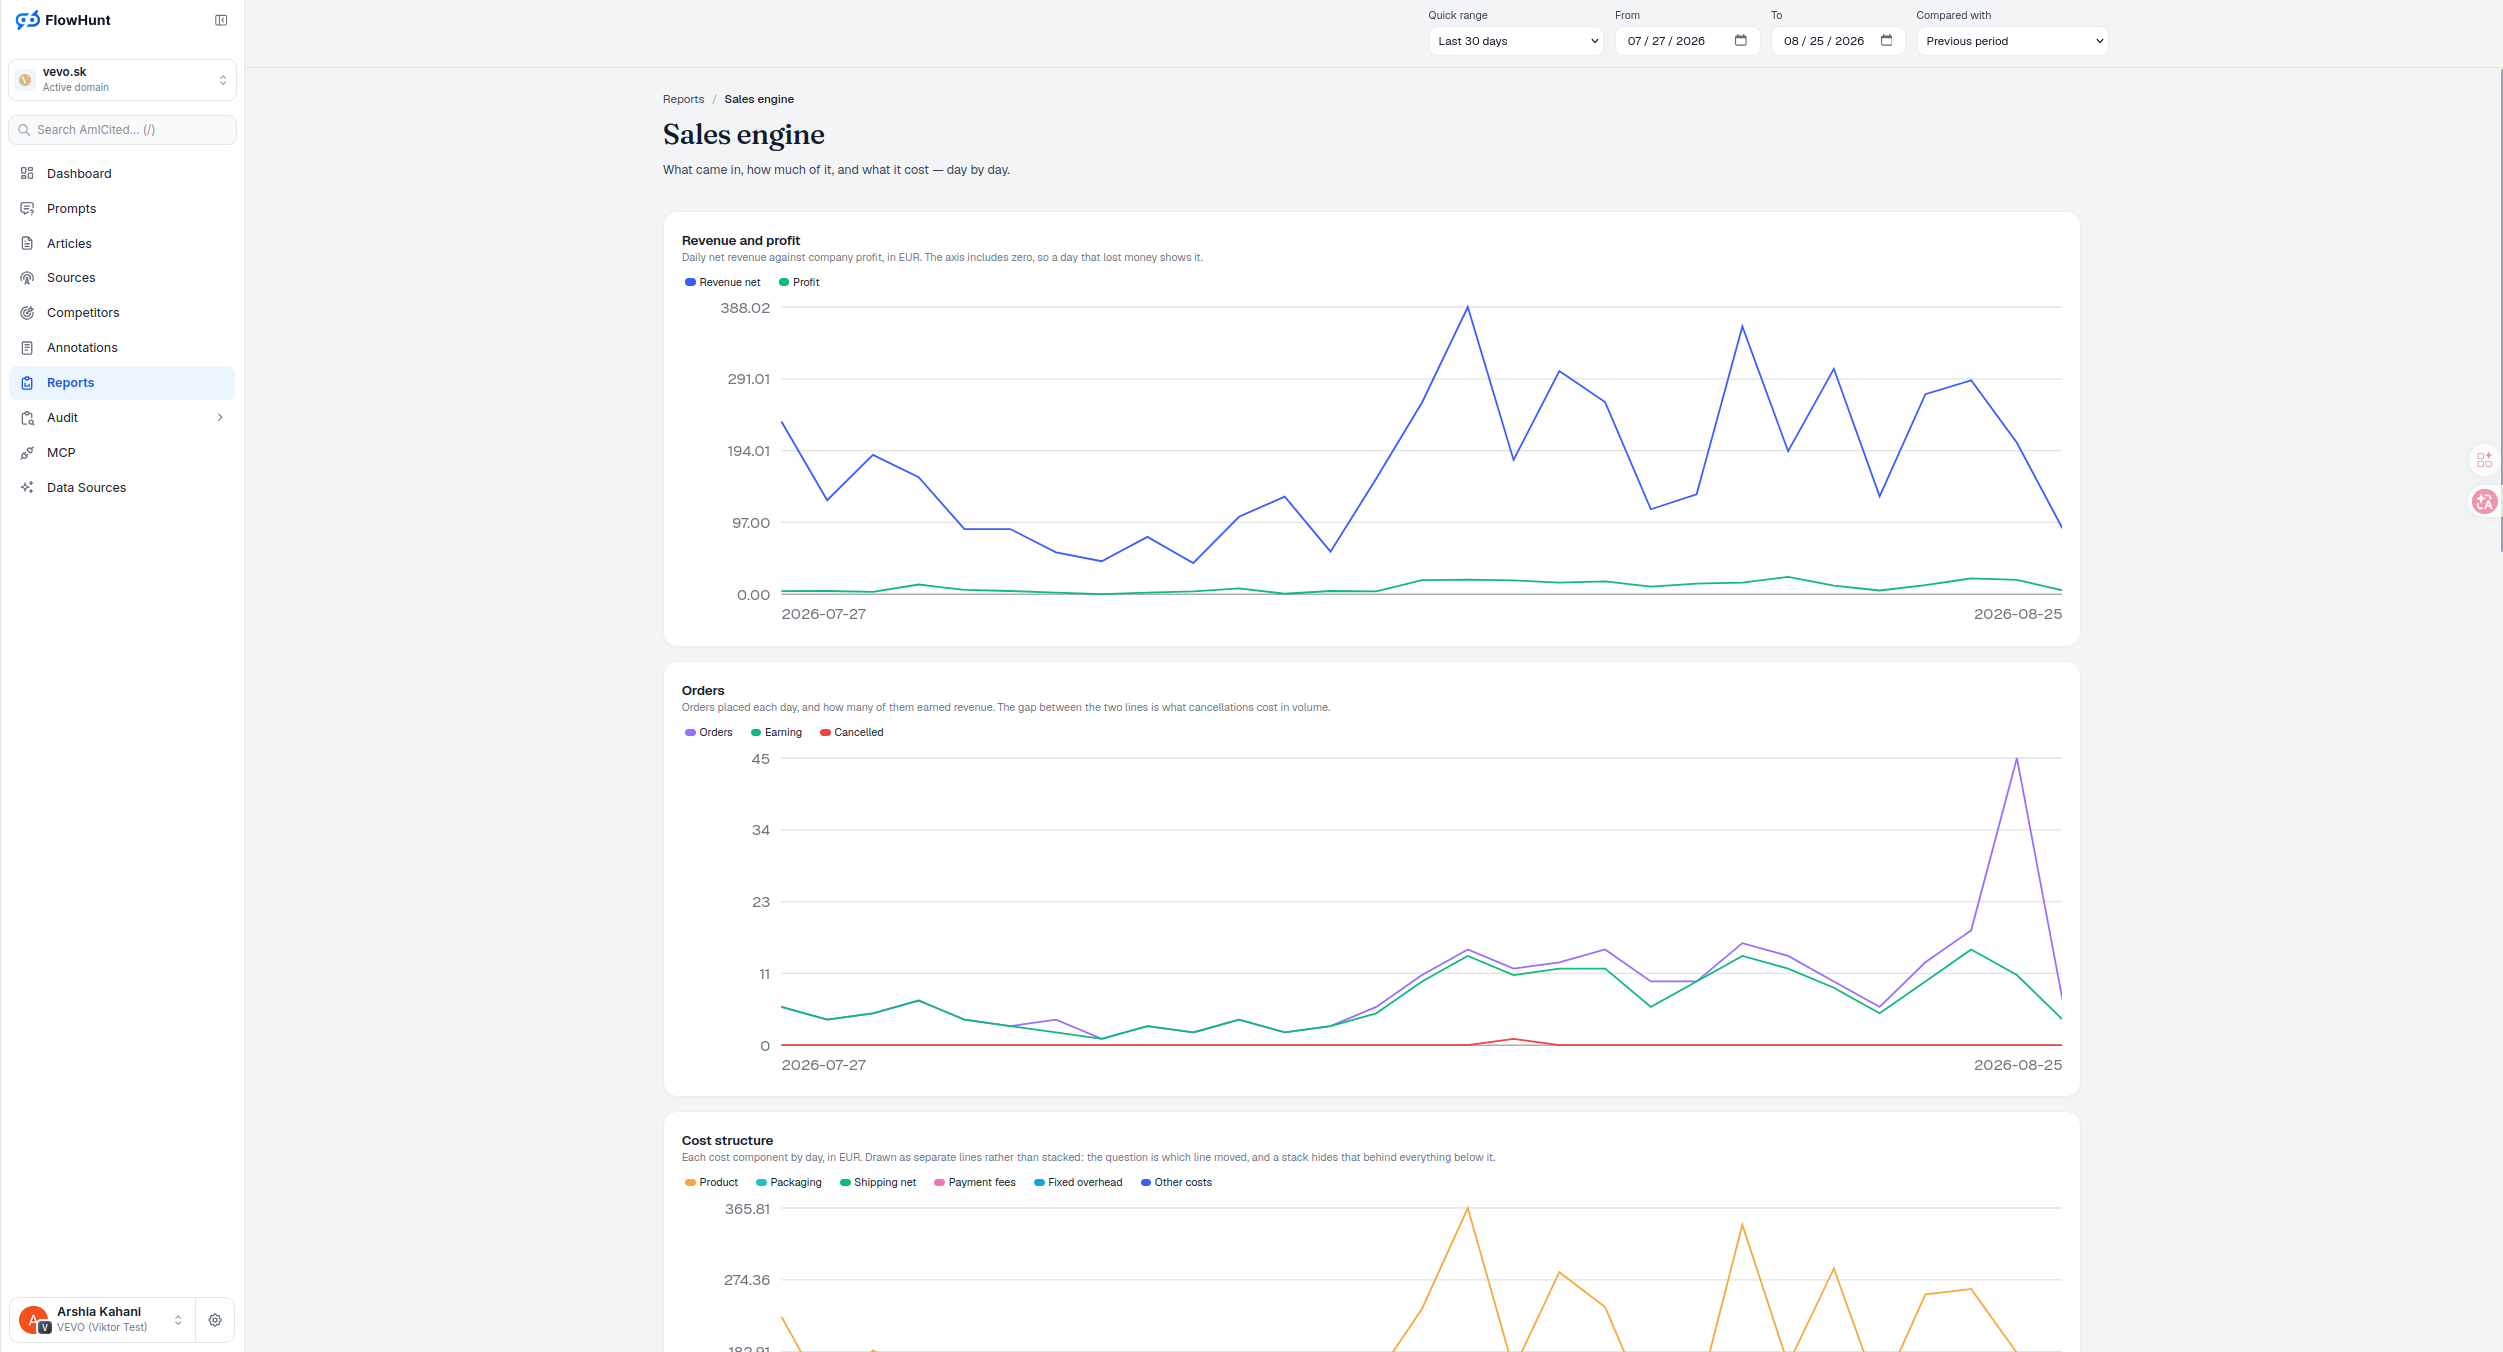
Revenue and Profit Trend Charts
Revenue and profit are drawn against an axis that includes zero on purpose — a day that lost money shows it, rather than getting compressed into a line that only ever looks like it’s trending up.
- Revenue and profit — daily net revenue against company profit, in EUR, on an axis that includes zero.
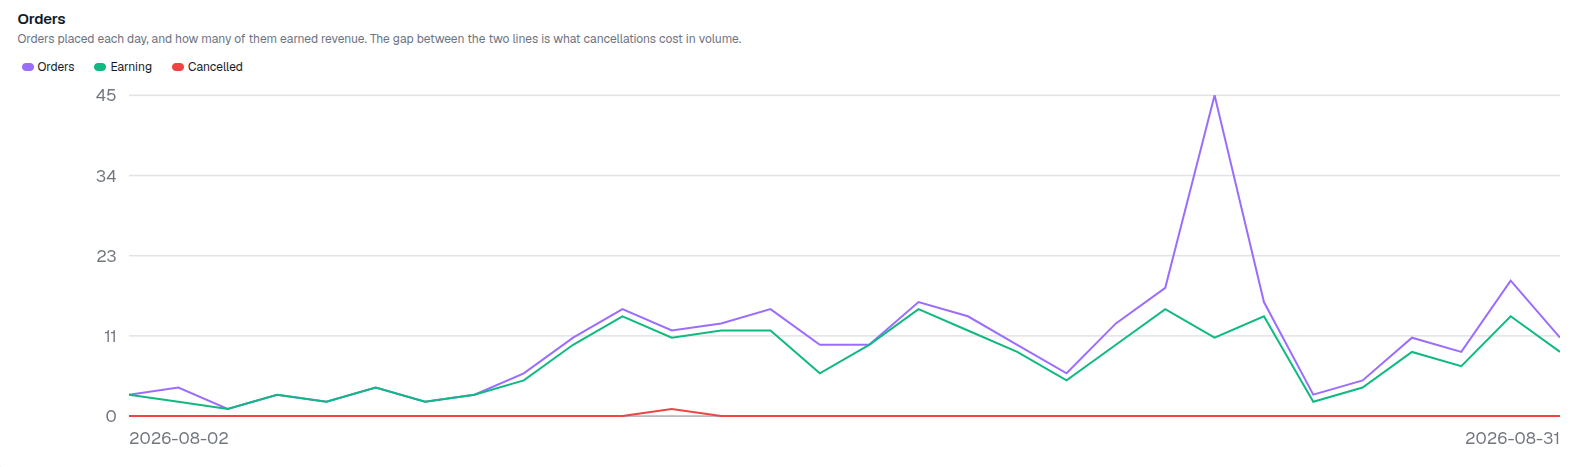
- Orders and cancellations report — orders placed each day against how many earned revenue; the gap between the lines is what cancellations cost in volume.
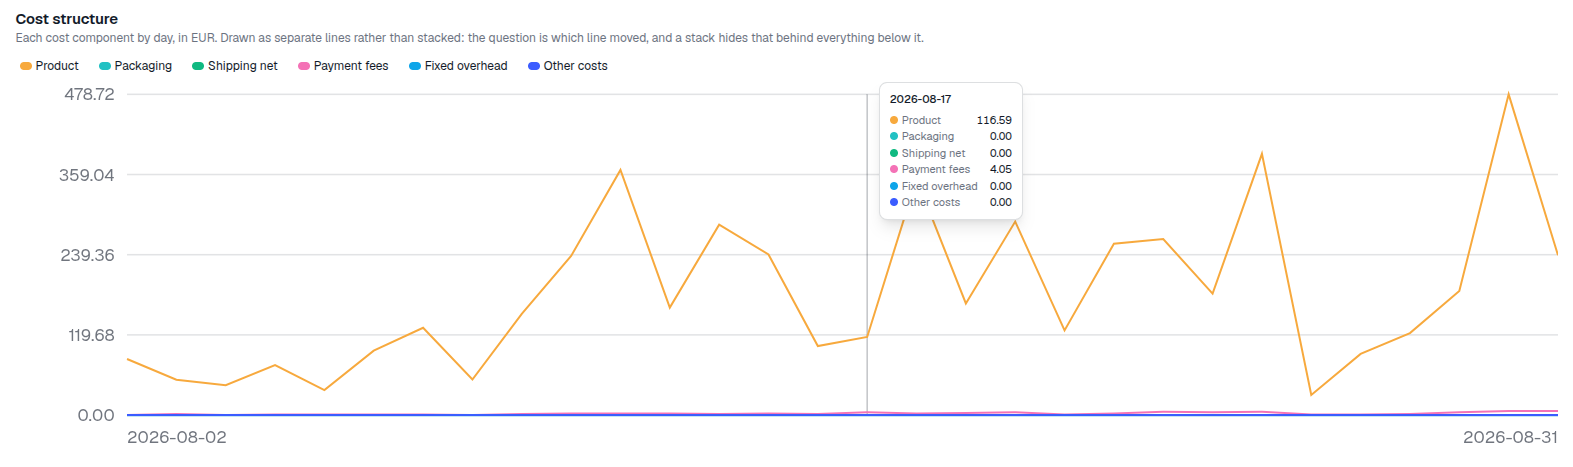
- Cost structure — every cost component as its own line by day, not stacked, so a spike in one is never hidden below another; ad spend only appears once an ad platform is connected, and its absence is never drawn as a zero line.
- Average order value, calculated daily — what a typical earning order was worth, divided only by orders that earned, since the rest brought no revenue to average.
- Cancellation rate — the share of each day’s orders cancelled, with days that had no orders left out rather than shown as a clean 0%.
- Daily P&L, exportable — nineteen columns from Orders to Profit, one row per trading day, downloadable as CSV.
- Meta relationship — Sales Engine is the realized shop ledger; Attribution Reality keeps these orders and net revenue separate from Meta’s claimed conversions and value.
Orders, AOV, and Cancellation Rate
Orders shows how many orders were placed each day and how many of them earned revenue. Average order value shows what a typical earning order was worth — dividing by earning orders only, since cancelled ones brought no revenue to average. Cancellation rate closes the loop: the share of each day’s orders cancelled, with orderless days excluded rather than drawn as a false 0%.
- Orders — Orders (purple), Earning (green), Cancelled (red); the gap between placed and earning is the volume cancellations cost.
- Average order value — a single blue line, orders and revenue can rise together or apart, and this is what says which happened.
- Cancellation rate — a single red line as a percentage; a wider count-gap on a busy day can still be a smaller rate, and this is the only chart that answers whether it’s getting worse.
Daily Ecommerce Profit and Loss Table
Day, Orders, Earning, Cancelled, Units, Revenue net, Discounts, Refunds, Product cost, Packaging, Shipping net, Payment fees, Ad spend, Fixed overhead, Other costs, CM1, CM2, CM3, Profit — the same figures behind every chart on this page, laid out day by day and exportable as CSV.
- No orders, no row — a day with no orders has no row rather than a row of zeros; it was closed, not loss-making.
- All nineteen columns, one place — from raw order counts through every cost line to CM1, CM2, CM3 and Profit.
- Sort any column — clicking a header re-sorts the full result, not just the loaded page; the active column flips direction, a new one starts descending and returns to page one.
- Export CSV — downloads the currently loaded 50-day page, not the whole selected range — page through first if you need more.
Customer Lifecycle and Buyer Type Metrics
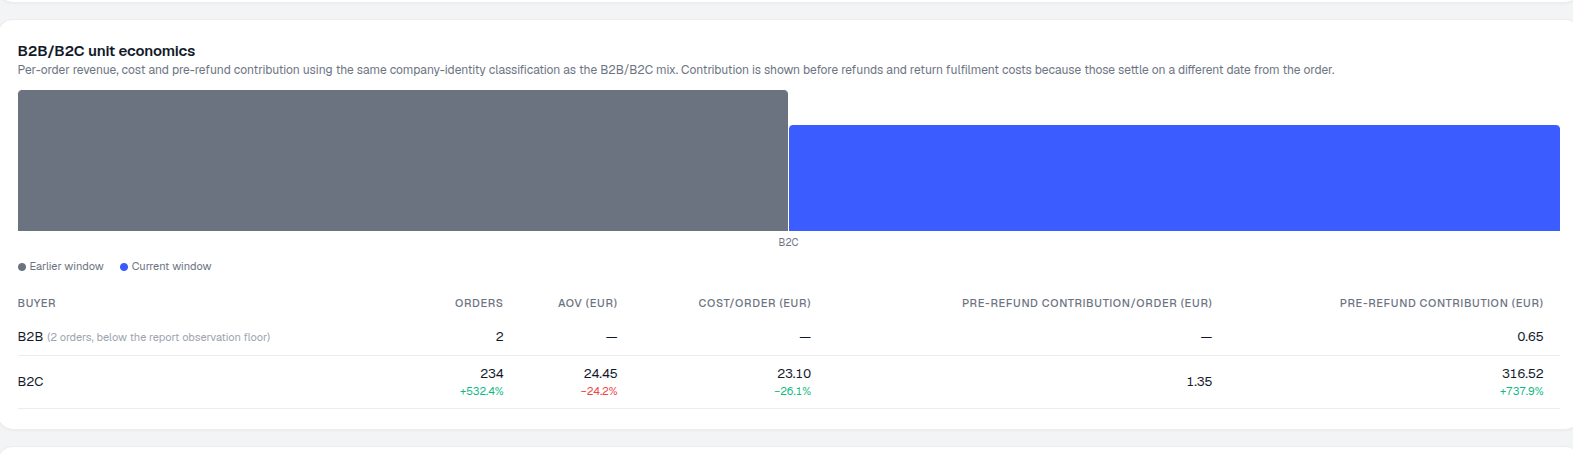
Past the six charts and the table, a lifecycle-proxy table groups customers by recency — customers, share, orders, days since last order — and a B2B/B2C bar compares average order value, cost per order and contribution across business and consumer orders on a shared scale. Both are timing-based inferences, not a recorded status field, so treat them as directional reads, not as a churn state or an account-type flag.
- Lifecycle proxy — customers grouped by recency, not by any stored lifecycle field.
- B2B/B2C split — orders, AOV, cost per order and contribution compared side by side on one scale.
- Withheld below 30 orders — a segment with too few orders shows no values or ratios, rather than a number too thin to act on.
- Comparison reaches this far and no further — the shared comparison window overlays a baseline on the B2B/B2C bars and a few table deltas; the six daily charts and the lifecycle table never show a prior period.
columns in the daily profit-and-loss table
One row per day the shop traded. A day with no orders has no row rather than a row of zeros — it was closed, not loss-making.
See EconomicsAnalyze Daily Revenue Orders and Costs
Six charts and a full exportable P&L table — revenue, orders, cost structure, average order value, cancellation rate, all in EUR.
Ready to see what your sales actually cost?
Free check · 7-day trial · card required