


Profit and Loss Statement
A profit and loss statement (P&L), also called an income statement, summarizes a business's revenue, costs, and expenses over a set period to show whether it made or lost money. For e-commerce stores, a P&L typically breaks down net revenue, cost of goods sold, gross margin, operating expenses, and net profit on a daily, weekly, or monthly basis.
Definition of a Profit and Loss Statement
A profit and loss statement (P&L), also known as an income statement, is a financial report that summarizes the revenue a business earned and the costs it incurred over a specific period — a week, a month, a quarter, or a year. Unlike a balance sheet, which is a snapshot of what a company owns and owes at one moment, a P&L is a moving picture of performance across time. For an e-commerce brand, the P&L is the single report that answers the most basic question an owner or investor can ask: after paying for the products, the ads, the shipping, and the software, did the store actually make money? A well-built P&L breaks that question into layers — gross revenue, net revenue after returns and discounts, cost of goods sold, gross profit, operating expenses, and finally net profit or loss — so that a founder can see not just the final number but which layer is helping or hurting it.
How a Profit and Loss Statement Is Built
Building a P&L starts with gross revenue: every dollar of sales recorded before deductions. From there, discounts, refunds, and returned merchandise are subtracted to arrive at net revenue — the figure that actually reflects money the business keeps. Cost of goods sold (COGS) is subtracted next, covering the direct cost of the products themselves plus directly attributable costs like inbound freight, giving gross profit. Operating expenses are then deducted: advertising spend, payment processing fees, outbound shipping, warehousing, software subscriptions, payroll, and rent if applicable. What remains is operating profit, and after accounting for any interest, taxes, or one-off items, the bottom line is net profit or net loss.
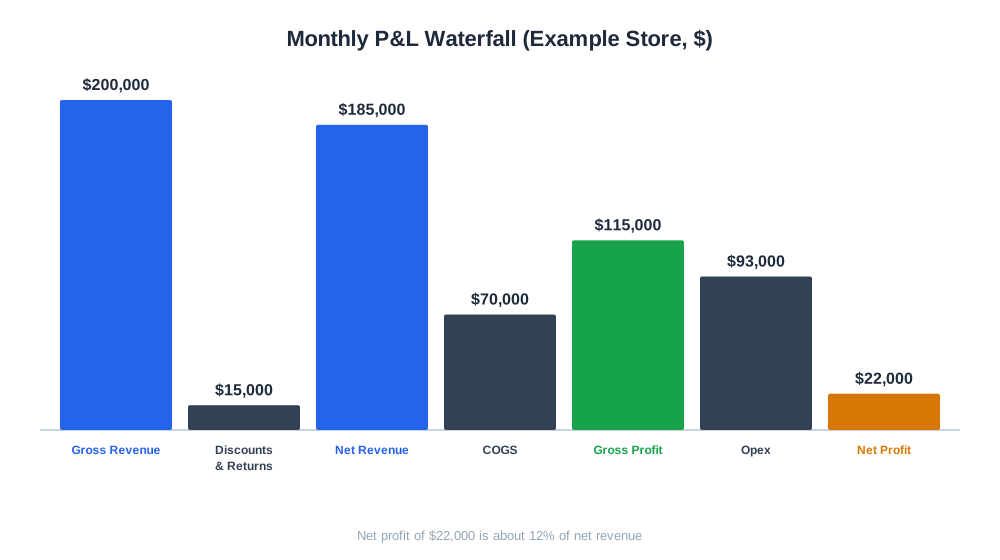
A simplified monthly example for a mid-size DTC store might look like this: gross revenue of 200,000 dollars, less 15,000 dollars in discounts and returns, giving net revenue of 185,000 dollars. Cost of goods sold of 70,000 dollars leaves gross profit of 115,000 dollars, a gross margin of about 62 percent. Operating expenses — 45,000 dollars in advertising, 12,000 dollars in shipping, 6,000 dollars in payment fees, and 30,000 dollars in payroll and software — total 93,000 dollars, leaving a net profit of 22,000 dollars, or roughly 12 percent of net revenue. Small shifts in any one line, particularly advertising spend or discounting, can swing that final number substantially.

Ready to Monitor Your AI Visibility?
Track how AI chatbots mention your brand across ChatGPT, Perplexity, and other platforms.
Why the P&L Matters for E-commerce Brands
A P&L is the primary tool for judging whether growth is healthy or hollow. Revenue alone is a vanity metric if margin is deteriorating underneath it — a store can grow gross sales by 30 percent year over year while net profit shrinks, because acquisition costs rose faster than revenue or because a heavier discounting calendar ate into gross margin. Lenders, investors, and acquirers almost always ask for a P&L before anything else, because it is the fastest way to assess whether a business model is sustainable. Internally, a P&L reviewed on a consistent cadence lets an operator catch problems early: a sudden jump in the cost of goods line might signal a supplier price increase that hasn’t been passed on to customers, and a growing gap between gross and net margin often points to marketing spend or fulfillment costs that have quietly crept up.
P&L Statement vs. Related Financial Reports
| Report | What It Shows | Time Frame | Primary Use |
|---|---|---|---|
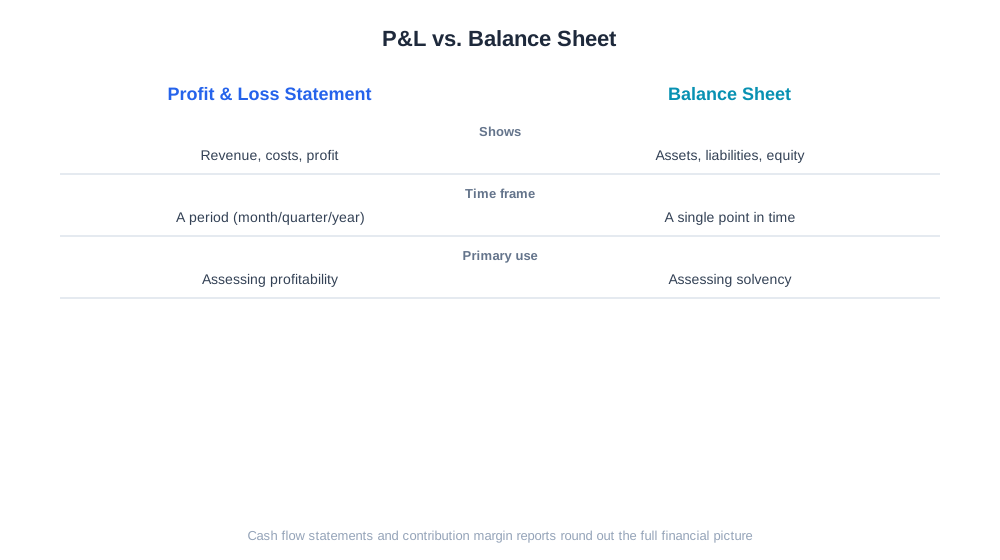
| Profit and Loss Statement | Revenue, costs, and profit | A period (month, quarter, year) | Assessing profitability |
| Balance Sheet | Assets, liabilities, and equity | A single point in time | Assessing solvency and net worth |
| Cash Flow Statement | Cash moving in and out of the business | A period | Assessing liquidity, not just profit |
| Contribution Margin Report | Profit per unit after variable costs | A period, often per SKU | Pricing and product-line decisions |
Stay Updated on AI Visibility Trends
Get the latest insights on AI mentions, brand monitoring, and optimization strategies.
Profit and Loss Statements in AI-Driven Commerce Analytics
As more e-commerce operators run stores with lean teams, the manual work of building a P&L from spreadsheets and bank statements has become one of the clearer places for automation to help. Rather than exporting order data, refund reports, and ad spend from separate platforms and reconciling them by hand each month, modern e-commerce analytics tools assemble the P&L continuously from connected data sources. AmICited’s eshop reporting tools include a ledger view that behaves like a running daily P&L: it pulls order revenue, discounts, refunds, and cost data together so a merchant can see gross revenue, cost of goods sold, and margin trending day by day rather than waiting for a monthly close. That kind of continuous view matters increasingly for brands that are also being discovered through AI shopping assistants like ChatGPT Shopping or Perplexity Shopping, where a spike in traffic from an AI citation can shift the revenue and discount lines within days — a P&L that only updates monthly will miss the story of whether that traffic was actually profitable.
Best Practices for Managing a Profit and Loss Statement
- Reconcile the P&L against actual bank and payment processor statements at least monthly to catch discrepancies from fees, chargebacks, or unrecorded refunds.
- Track gross margin and net margin as percentages, not just dollar totals, so seasonal revenue swings don’t obscure real profitability trends.
- Separate cost of goods sold from operating expenses cleanly — lumping shipping or packaging into COGS versus opex inconsistently makes month-over-month comparisons meaningless.
- Build a rolling 90-day view alongside the monthly statement so a single bad or unusually good month doesn’t distort strategic decisions.
- Review the P&L against the marketing calendar; large discount events or ad pushes should be visible as identifiable dips or spikes in specific lines, not just a blurred average.
Common Profit and Loss Statement Mistakes
Many early-stage e-commerce founders build a P&L that only tracks revenue and ad spend, leaving out fulfillment, payment processing fees, and software subscriptions entirely; the result is a statement that looks healthy while the real net margin is thin or negative. Another frequent mistake is recording revenue at the gross sale price rather than net of discounts and refunds, which inflates the top line and makes margin percentages look better than they are — a store running frequent site-wide discounts needs net revenue as the baseline for every downstream percentage to mean anything. A third common problem is inconsistent period boundaries: comparing a 31-day month against a 28-day month without normalizing for day count makes trend lines misleading, particularly for stores with steady daily order volume. Some businesses also fail to separate one-time costs, like a large inventory write-off or a one-off software migration fee, from recurring operating expenses, which distorts the trend and can trigger unnecessary alarm or false confidence in a single month’s numbers. Finally, a P&L built entirely by hand in spreadsheets tends to lag reality by weeks, meaning a margin problem that started at the beginning of a promotional period is often not visible until after the promotion has ended and the damage is already done — a strong argument for connecting the P&L directly to live order and cost data rather than rebuilding it from scratch each month.