


How to Check Your Core Web Vitals
Check your homepage's Core Web Vitals in AmICited, with real-world LCP, INP, CLS, FCP and TTFB data from Chrome UX Report.

Fast, stable pages matter for AI visibility too: answer engines favor quick-loading sources. Before you dig into AmICited’s audit, it helps to understand what Core Web Vitals actually measure and why a page speed problem can quietly become an AI citation problem.
Quick Steps
- Open Audit → Web Vitals to see your homepage’s LCP, INP, CLS, FCP, and TTFB, pulled from real Chrome UX Report data.
- Your domain is flagged You, benchmarked against every competitor you’re tracking, so every metric is compared, not viewed alone.
- Blank values are normal for low-traffic domains; CrUX needs a minimum volume of real visits before it publishes numbers.
- Fix reds first, prioritizing TTFB since it’s upstream of the other metrics and often the fastest to improve.
- Re-check after changes; CrUX is a rolling 28-day window, so improvements take time to show up.
What are Core Web Vitals?
Core Web Vitals are a set of standardized metrics Google created to quantify real-world page experience : how fast a page’s main content appears, how quickly it responds to input, and how visually stable it stays while loading. They were designed to replace vague notions of “site feels slow” with numbers you can track, benchmark, and hold engineering teams accountable to. Google folded them into its search ranking signals years ago, and the same underlying data (collected from real Chrome users via the Chrome UX Report, or CrUX) increasingly informs which sources answer engines are willing to fetch, render, and cite.
The three core metrics are Largest Contentful Paint (LCP), Interaction to Next Paint (INP), and Cumulative Layout Shift (CLS), each paired with a pass/fail threshold Google publishes and updates periodically. Two supporting metrics, First Contentful Paint (FCP) and Time to First Byte (TTFB), round out the full page speed picture by isolating how quickly the server responds and how quickly anything renders, even before the main content is ready. Because CrUX is built from anonymized field data (actual visits by actual Chrome users), the numbers reflect real conditions (device mix, network quality, geography) rather than a single lab test run on a fast office connection.
Why does this matter for generative engine optimization specifically? AI crawlers and the retrieval systems behind AI Overviews, ChatGPT search, and Perplexity have to fetch and parse your page before they can cite it. A page that times out, renders slowly, or shifts content around while loading is more expensive to crawl at scale and less reliable to extract clean content from. Slow TTFB in particular can cause a crawler to abandon a fetch before your main content ever arrives. None of this is the dominant factor in whether you get cited (content relevance, authority, and structure matter far more), but a chronically slow or unstable homepage is friction that answer engines have no reason to tolerate when a faster competitor is offering the same information.
This is also a case where technical SEO and answer engine optimization overlap almost completely: the same engineering fixes that improve your Google rankings (image sizing, server response time, layout stability) are the ones that keep your pages accessible and citable to AI systems. That overlap is exactly why AmICited surfaces Core Web Vitals inside a broader AI visibility audit rather than as a standalone SEO tool: it’s one input into whether AI engines find your site trustworthy and easy to work with.
Where to find it
Open Audit → Web Vitals from the left navigation. The page explains it: “Core Web Vitals for your domain’s homepage… page speed is a Google ranking factor and AI answer engines favor quick-loading pages.” AmICited pulls this data automatically for your tracked domain and for each competitor you’re monitoring, so you don’t need to run a separate tool or paste in URLs manually: it’s the same competitive set you’re already using to track share of voice and citation rank elsewhere in the platform.
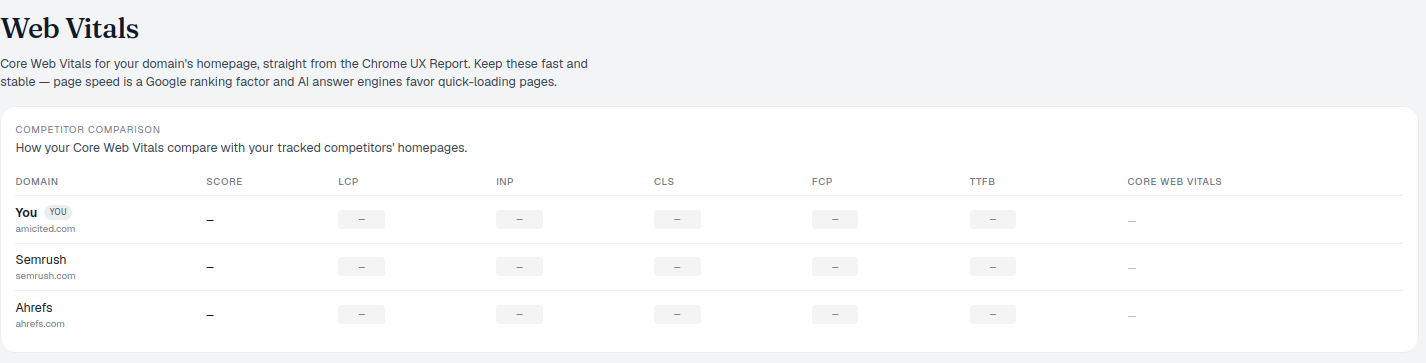
Because CrUX requires a minimum volume of real Chrome traffic before it will publish stable numbers for a URL, low-traffic domains, including many B2B and niche sites, will sometimes show blank values for a period. That’s expected behavior, not a bug: it means Google hasn’t yet accumulated enough field data to report with confidence, and it will populate once traffic (or time) accrues.
What the metrics mean
The competitor comparison table lists each domain with:
- Score: an overall Core Web Vitals pass/fail summary, giving you a single glance at whether a domain clears Google’s thresholds across the board.
- LCP (Largest Contentful Paint): how fast the main content loads, typically the largest image or text block in the viewport. This is the metric most directly tied to a visitor’s, or a crawler’s, perception of “is this page ready yet.”
- INP (Interaction to Next Paint): how responsive the page feels when a user actually interacts with it (clicking, tapping, typing). It replaced the older First Input Delay metric because it captures responsiveness across the entire page visit, not just the first interaction.
- CLS (Cumulative Layout Shift): how visually stable the page is while it loads. High CLS means elements jump around as images, ads, or fonts load in, which is disruptive for visitors and can make content harder for automated systems to parse consistently.
- FCP (First Contentful Paint): how fast something first appears on screen, even before the main content is ready. It’s an early signal that the page is loading at all, rather than sitting on a blank screen.
- TTFB (Time to First Byte): server response speed: the time between requesting the page and receiving the first byte back. This is almost entirely a backend/infrastructure metric, and it’s often the easiest one to fix with hosting, caching, or CDN changes.
Your own domain is flagged You, with your tracked competitors’ homepages beneath it, so every metric is immediately benchmarked rather than viewed in isolation.
How to use it
- Benchmark against rivals. If competitors’ pages are faster, that’s one more edge they have in both search and AI answers, and a gap that’s cheap to close relative to content or authority work.
- Fix the reds. A failing LCP or CLS points to specific engineering work: oversized hero images, missing width/height attributes, render-blocking scripts, or unoptimized web fonts are the usual culprits.
- Prioritize TTFB if it’s slow. Because it sits upstream of every other metric, a slow TTFB drags down LCP too, and it’s frequently the fastest metric to improve, often through caching, a CDN, or a hosting upgrade rather than a content rewrite.
- Re-check after changes. As field data updates, come back to confirm improvements landed. CrUX data is a rolling 28-day window, so changes take time to show up: don’t expect the numbers to move the day after a deploy.
- Treat TTFB as an early-warning signal. A server that regularly takes over a second to return the first byte is a strong candidate for crawl and rendering problems well beyond this one audit. It’s worth reading up on why crawler engineers increasingly treat fast TTFB as a threshold for reliable AI crawler success rather than a nice-to-have.
None of these four metrics operates in isolation from the rest of your technical footprint. A homepage that scores well on Core Web Vitals but blocks AI crawlers in robots.txt, or serves a mostly empty page to non-JavaScript clients, still won’t get cited: speed only helps once a crawler is actually allowed in and can parse what’s there. That’s why it’s worth treating this audit as one checkpoint inside a wider routine rather than a one-off fix: run it alongside your other AmICited audits on a regular cadence, the same way you’d periodically revisit a broader technical audit checklist covering crawlability, structured data, and content extractability.
Web Vitals won’t win citations on their own, but slow, unstable pages can hold you back: this audit tells you where you stand relative to the sites AI engines are choosing between. If you want the deeper research behind the recommendation, read up on whether page speed actually affects AI search visibility , and pair this check with a broader AI accessibility audit of your site to cover the crawlability side of the equation. From there, the natural next step is folding Web Vitals into your regular monitoring cadence alongside AmICited’s AI rank tracker and citation tracking, so a performance regression gets caught at the same time you’d notice a drop in mentions, rather than discovered separately, weeks later, once it’s already cost you visibility.
Frequently asked questions
Blank values are normal for low-traffic domains. The data comes from the Chrome UX Report (CrUX), which needs a minimum volume of real Chrome visits before it will publish stable numbers for a URL. It means Google hasn't yet collected enough field data to report with confidence, not that something is wrong with your page.
Prioritize TTFB (Time to First Byte) if it's slow. It's almost entirely a backend/infrastructure metric, it sits upstream of every other metric so a slow TTFB drags down LCP too, and it's usually the fastest one to improve through caching, a CDN, or a hosting upgrade rather than a content rewrite.
Not directly, and not as much as content relevance, authority, and structure. But AI crawlers still have to fetch and parse your page before they can cite it, and a slow TTFB can cause a crawler to abandon a fetch before your main content even arrives. Speed is friction, not the dominant factor, so it's worth fixing but won't substitute for good content.
CrUX data is a rolling 28-day window, so it reflects real visitor traffic accumulated over that period rather than an instant snapshot. Improvements you ship today take time to show up as the window rolls forward. Re-check after a few weeks rather than expecting the numbers to move the day after a deploy.
More tutorials in this section
 How to Check Your Agent Accessibility Score
Review your Agent Readiness Summary for llms.txt, accessibility, crawler access, sitemaps, WebMCP and …
Read guide →
How to Check Your Agent Accessibility Score
Review your Agent Readiness Summary for llms.txt, accessibility, crawler access, sitemaps, WebMCP and …
Read guide →
 How to Review Your llms.txt File
Use AmICited to fetch and validate your llms.txt file, which helps AI agents understand your website.
Read guide →
How to Review Your llms.txt File
Use AmICited to fetch and validate your llms.txt file, which helps AI agents understand your website.
Read guide →
 How to Check Robots.txt & Sitemap Coverage
Check robots.txt and sitemap coverage in AmICited to confirm AI crawlers can access your site and find your …
Read guide →
How to Check Robots.txt & Sitemap Coverage
Check robots.txt and sitemap coverage in AmICited to confirm AI crawlers can access your site and find your …
Read guide →Ready to put it into practice?
Free check · 7-day trial · card required