


How to Read Your Competitors Overview Stats
Review tracked competitors, detected brands, rank, share and category leader stats on the AmICited Competitors page.

Five numbers at the top of a page can tell you exactly how you stack up against every brand AI engines mention in your category, if you know how to read them.
At a Glance
- The Competitors page stats bar shows five numbers: Tracked, Detected, Your rank, Your share, Category leader.
- Tracked and Detected define the scope of your competitive set: who you’re benchmarking and who’s a candidate.
- Your rank and Your share are your scoreboard: position in the field and percentage of category citations.
- Category leader is the brand to study and, eventually, challenge.
- Read rank and share together, since they can move independently and answer different questions.
What Is Competitive AI Visibility?
When someone asks ChatGPT, Perplexity, Gemini or Google AI Overviews a question like “what’s the best project management tool for small teams,” the answer rarely names just one brand. It names several, in some order, with some brands appearing more consistently than others across repeated queries. That pattern, who gets named, how often, and in what position, is what AI competitive intelligence is built to measure. It’s the AI-era equivalent of watching your competitors’ keyword rankings in Google, except the “results page” is a generated paragraph of text that’s different every time it’s asked, and the “ranking” is really a mix of citation frequency, position within the answer, and how the AI describes each brand.
This matters because AI answers are increasingly where buying decisions start. If your competitors show up in more of these generated answers than you do, they’re capturing consideration and trust before a prospect ever visits a website. Traditional SEO tools can’t see this: they track blue links, not generated prose. That’s the gap that competitive AI visibility tracking closes: it treats every AI answer as a data point, aggregates thousands of them across your tracked prompts, and turns “who gets mentioned” into a measurable, comparable metric.
The core metric behind this comparison is share of voice : the percentage of category-relevant AI answers in which your brand is the one named, relative to every other brand competing for the same attention. A brand with a 40% share of voice is mentioned in roughly four out of every ten relevant AI answers; a brand with 4% is a rounding error. Share of voice is a relative metric by design: it only means something in relation to the rest of the field, which is exactly why it needs a dedicated competitive view rather than a single-brand dashboard.
Alongside share of voice sits ranking position : where in the list of named brands you actually fall. Two brands can have similar mention counts but very different outcomes if one is consistently named first and the other fifth; position affects how much weight a reader gives the mention. Put share and rank together and you get a genuine competitive scoreboard: not just “are we mentioned,” but “are we winning.”
Where to find it
The Competitors page tracks the brands AI engines mention alongside yours. The stats bar at the top gives you the headline of the whole competitive picture in five numbers. It sits directly under the Competitors page title, which explains the page in plain language: “Track the brands AI engines mention alongside [your domain]. We detect new competitors automatically, add the ones you care about to see them in your charts.”

What each stat means
- Tracked: how many competitors you’ve actively added to your charts. These are the brands you’ve deliberately chosen to benchmark against, and they’re the ones that populate the comparison charts, trend lines, and share-of-voice breakdowns further down the page.
- Detected: how many brands AmICited has auto-detected being cited alongside you across your tracked prompts. This number grows on its own as AI answers evolve; it’s a running list of candidates worth reviewing, not brands you’ve confirmed as relevant rivals yet.
- Your rank: your position among all named brands for your category (e.g.
#11). This is calculated from how consistently and how prominently you’re mentioned relative to everyone else AI engines cite in the same space. - Your share: your share of category answers, i.e. how often you’re the brand named. This is the same underlying metric introduced above: the proportion of all relevant AI answers in which your brand, specifically, gets the citation.
- Category leader: the brand that dominates your category’s AI mentions. This is the benchmark every other stat on the page is implicitly measured against.
How to use it
- Read Your rank + Your share as your scoreboard. A low share and a double-digit rank means lots of room to climb. Check this pairing on a regular cadence rather than once: a single snapshot tells you where you stand today, but tracking it over weeks tells you whether your content and citation-building work is actually moving the needle. This is the same discipline behind competitive benchmarking : the value comes from the trend, not the single number.
- Mind the Detected count. A high number means AmICited found many brands worth reviewing: check the Detected competitors list and add the real ones to Tracked so they show up in your comparison charts. Brands that only appear once or twice may be noise; brands that keep resurfacing across your prompts are worth tracking deliberately.
- Know the leader. Whoever holds Category leader is the brand to study and, eventually, to challenge. Look at which prompts they win, which AI engines favor them, and what their answers say about them: that’s usually the fastest way to find the gap between where you are and where they are.
- Cross-reference with your prompt-level data. The overview stats are an aggregate; if Your rank looks worse than expected, drill into which specific prompts you’re losing on. That’s often where you’ll find that you’re strong on a handful of high-volume prompts but invisible on adjacent ones the leader owns, the same gap-finding approach covered in this breakdown of share of voice gaps .
The charts and lists below turn these headlines into the detail: who’s ahead, by how much, and which brands to track. Together, Tracked and Detected tell you the scope of your competitive set; Your rank and Your share tell you your standing within it; and Category leader gives you a fixed point to measure progress against every time you come back to the page.
Why rank and share of voice sometimes move independently
It’s worth understanding why these two numbers don’t always move together, because it’s a common source of confusion. Your rank is ordinal: it only tells you where you fall in a list, not by how much. You could jump from rank #11 to rank #8 while your actual share of voice barely changes, if a handful of smaller competitors dropped out of the running. Conversely, your share could climb meaningfully (say from 4% to 7%) without moving your rank at all, if the brands above you are growing just as fast. Neither number is “more correct” than the other; they answer different questions. Rank answers “how many brands am I ahead of,” while share answers “how much of the total attention am I actually capturing.” Reading them together, rather than picking one as your single KPI, is what keeps you from over- or under-reacting to a single week’s movement. Some teams find it useful to treat rank as a headline for stakeholders and share as the working number for judging whether specific content or citation-building efforts are paying off, a distinction covered in more depth in this comparison of citation rate vs. mention rate
as competing ways to size up AI visibility.
Turning the stats into action
Once you know where you stand, the useful next step is figuring out why. If your share is low despite decent rank, it usually means you’re winning on a narrow set of prompts and absent everywhere else, worth checking against your prompt library to find which prompts trigger AI to mention your brand versus which ones consistently favor competitors instead. If Detected keeps surfacing the same handful of names, that’s usually a sign your category definition in AmICited is accurate and those brands deserve a permanent seat in your Tracked list. And if the gap to Category leader looks enormous, don’t treat it as one number to close in one move: break it down by AI engine and by prompt cluster, since leaders are rarely dominant everywhere equally.
Where you take this next depends on what the stats reveal. If you’re an agency managing this view across several client accounts, the same overview logic scales into portfolio-level reporting through solutions built for agencies , where each client gets their own tracked competitor set and share-of-voice baseline. If you’re using this page as your primary way to monitor standing over time, it sits alongside the broader AI visibility tooling and the AI rank tracker , both of which feed the same underlying citation data that populates this stats bar, so improvements you make to close the gap with your Category leader should show up here first, before they show up anywhere else in your reporting.
Frequently asked questions
Tracked (competitors you've actively added to your charts), Detected (brands AmICited auto-detected being cited alongside you), Your rank (your position among all named brands in your category), Your share (your percentage of category citations), and Category leader (the brand that dominates your category's AI mentions).
Tracked competitors are brands you've deliberately added to your charts, and they populate the comparison charts and share-of-voice breakdowns. Detected competitors are candidates AmICited found automatically being cited alongside you across your prompts; it's a running list worth reviewing, not brands you've confirmed as relevant rivals yet.
Rank is ordinal: it only tells you your position in a list, not by how much, so you could move from #11 to #8 just because smaller competitors dropped out. Share answers a different question, how much total attention you actually capture, and can climb without moving your rank if the brands above you are growing at the same pace.
It usually means you're winning on a narrow set of prompts and largely absent elsewhere. Check your prompt library against the prompts your Category leader wins to find which specific questions consistently favor competitors instead of you, then prioritize content for those gaps rather than treating the overall rank as the full picture.
More tutorials in this section
 How Does AmICited Auto-Detect Competitors?
Learn how AmICited detects brands cited alongside you in AI answers, then review or add competitors to your …
Read guide →
How Does AmICited Auto-Detect Competitors?
Learn how AmICited detects brands cited alongside you in AI answers, then review or add competitors to your …
Read guide →
 Compare AI Share of Voice with Competitors
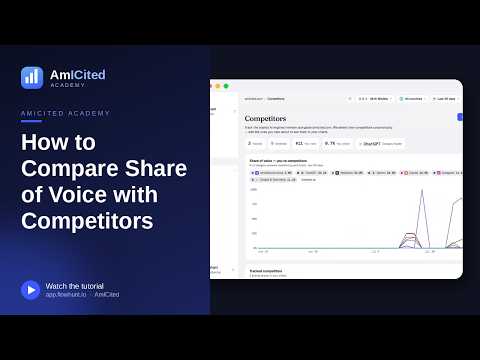
Compare your share of AI answers with competitors over time using the AmICited Competitors chart.
Read guide →
Compare AI Share of Voice with Competitors
Compare your share of AI answers with competitors over time using the AmICited Competitors chart.
Read guide →
 How to Manually Add a Competitor
Add a competitor by URL in AmICited to track its domain and find keywords to monitor as prompts.
Read guide →
How to Manually Add a Competitor
Add a competitor by URL in AmICited to track its domain and find keywords to monitor as prompts.
Read guide →Ready to put it into practice?
Free check · 7-day trial · card required