


How to Check Your Total Citations
Find the Total Citations counter on the AmICited dashboard and learn how it tracks changes in your brand’s AI citations.

Total Citations is the raw count of how many times AI engines cited your brand across your tracked prompts in the selected period. It’s the volume number behind your percentage-based metrics.
At a Glance
- Total Citations is the first counter on the Dashboard, showing your raw citation count plus the change vs the previous period and a sparkline.
- A citation is one instance of an AI engine (ChatGPT, Perplexity, Gemini, Google AI Overviews) referencing your brand for a tracked prompt; one prompt run can produce several.
- The number can rise simply because you added more prompts, so read it alongside Share of Voice and citation rate to judge real gains.
- Use the sparkline to tie spikes to specific content or prompts, and segment by engine if growth plateaus.
- Change the date range to compare periods; 30-day windows are more reliable than week-over-week comparisons.
What is an AI citation?
An AI citation is any instance where a generative AI system (ChatGPT, Perplexity, Gemini, or Google AI Overviews) names, links to, or directly references your brand or domain while answering a user’s question. This is different from traditional search ranking, where a page either appears in the results or doesn’t. In an AI answer, your brand can be cited once, several times, or not at all, depending on whether the model judged your content the best available source for that specific query at that specific moment.
Citations are the foundational unit of measurement in AI search visibility , sometimes called AI-visibility monitoring or generative engine optimization (GEO). Every other metric you’ll encounter in AmICited, from share of voice to citation rate to competitive position, is derived from counting and comparing citations across a set of tracked prompts. Understanding citations first makes those downstream metrics much easier to interpret.
It helps to know that a citation is not the same as a brand mention in casual conversation, and it’s not the same as a backlink in classic SEO. AI engines assemble answers by synthesizing information from multiple sources in real time, and they choose which sources to surface based on relevance, trustworthiness signals, structured content, and freshness. A single question can pull in citations from several competing brands at once, which is why AI visibility is inherently a share-of-attention game rather than a single winner-takes-all ranking. If you want the fuller distinction between a citation and a passing mention, it’s worth understanding AI citations vs. mentions in more depth.
Why does this matter commercially? Because citations are increasingly where buying research starts. When someone asks an AI assistant “what’s the best tool for X” or “which vendor handles Y,” the brands that get cited are the brands that enter the consideration set, often before the user ever visits a search engine or a comparison page. Total Citations is the volume metric that tells you how much of that AI-driven consideration your brand is currently capturing, and whether that volume is trending up or down.

Where to find it
It’s the first of the four counter cards in the row just below the headline metrics on the Dashboard. In the example it shows 44, with ▲ +44.0 vs previous period and a small sparkline showing when those citations landed. Because it sits at the far left of the row, it functions as the anchor number for the rest of the dashboard: everything else you look at (Share of Voice, Citation Rate, competitor comparisons) is a way of putting this raw count into context.
What counts as a citation
A citation is a single instance of an AI engine referencing your domain in its answer to one of your tracked prompts. One prompt run can produce several citations (across different engines), and the same page can be cited many times. Total Citations sums all of them for the current filter scope.
This matters when you’re interpreting the number: a citation isn’t tied to a single engine or a single day. If you track the same prompt across ChatGPT, Perplexity, Gemini, and Google AI Overviews, and three of those four engines cite you when answering it, that’s three citations from one prompt. Add in daily or weekly re-runs of your full prompt set, and Total Citations becomes a cumulative tally across engines, prompts, and time, which is exactly why the trend indicator next to it matters as much as the number itself.
It’s also worth remembering that citations reflect a point-in-time judgment by the model. AI engines don’t cache their answers the way a search index does; each run can pull in different sources depending on what content is freshest, best structured, or most authoritative at that moment. That’s why the same tracked prompt can generate a citation for your brand one week and not the next, and why watching the trend over time tells you far more than any single day’s snapshot.
How to read it
- The number is your absolute citation volume for the period.
- The
vs previous periodchange tells you the direction of travel:+44.0means you gained 44 citations compared with the previous window of the same length. - The sparkline shows the shape of that activity: a flat line with one spike means your citations are clustered around specific days (often right after content went live or was re-crawled).
Reading these three elements together gives you a quick diagnostic. A rising number with a steady sparkline suggests broad, sustained improvement in how AI engines treat your brand. A rising number with one sharp spike usually means a single piece of content, a single prompt, or a single engine update is doing most of the work, which is worth investigating before you assume the gain is durable. A flat or falling number, meanwhile, is your signal to dig into which prompts or engines dropped off, using the filters described below.
How to use it
- Track volume alongside share. Total Citations can rise simply because you added more prompts. Read it next to Share of Voice to know whether you’re genuinely winning more of the conversation or just measuring more of it. Volume and share answer different questions: volume tells you how much AI attention you’re capturing in absolute terms, while share tells you how you’re doing relative to competitors named in the same answers.
- Tie spikes to actions. Use the sparkline to connect jumps in citations to content you published, pages you restructured, or prompts you added. If you recently worked through a content gap analysis or shipped new pages targeting specific prompts, this is where you’ll see whether that work translated into actual citations.
- Change the date range at the top of the page to compare months, or narrow to a single engine to see which one drives most of your volume. Comparing a 30-day window against the prior 30 days is usually more reliable than comparing week over week, since AI answers can vary day to day even without any change on your end.
- Cross-check against citation rate, not just raw count. A prompt set with 200 prompts and a citation rate of 10% will always show a higher Total Citations number than a tightly curated set of 20 prompts with a 60% citation rate , even though the second scenario reflects far stronger AI visibility per prompt. If your prompt list grows over time, expect Total Citations to grow with it regardless of underlying performance.
- Segment by engine when volume plateaus. If Total Citations stalls, filter to one engine at a time. It’s common to see growth on one platform (say, Perplexity) offsetting a decline on another (say, an AI Overviews update that changed which sources it favors), and the blended total can mask both trends.
Total Citations is the best starting point for any AI-visibility review precisely because it’s unambiguous: it’s a count, not a ratio or a score, so there’s nothing to normalize before you can compare periods. Once you’ve confirmed the trend is heading the right way, the natural next step is to dig into why: which prompts are driving it, which engines are contributing, and how your citation volume stacks up against named competitors. That’s where the rest of the AI visibility dashboard comes in, and where tools like AmICited’s AI rank tracker help you go from “we’re being cited more” to “here’s exactly which content and prompts are earning those citations, and how to get more of them.” If you’re managing this across multiple client accounts, the same counter and trend logic carries over to every workspace under AmICited for agencies , making Total Citations a consistent baseline metric no matter how many brands you’re tracking.
Frequently asked questions
A citation is one instance of an AI engine, ChatGPT, Perplexity, Gemini, or Google AI Overviews, referencing your brand while answering one of your tracked prompts. One prompt run can produce several citations if multiple engines cite you for it, and Total Citations sums all of them across engines, prompts, and time for the current filter scope.
Total Citations can rise simply because you added more tracked prompts, since more prompts means more opportunities to be cited. Read the raw count alongside Share of Voice and citation rate to tell a real gain from a bigger measurement set: those metrics normalize for how many prompts you're tracking.
Total Citations is a raw count; citation rate is a percentage. A prompt set with 200 prompts and a 10% citation rate will always show a higher Total Citations number than a tightly curated set of 20 prompts with a 60% citation rate, even though the second reflects far stronger AI visibility per prompt. Cross-check both before drawing conclusions.
Use it to tie spikes in citation volume to specific events, like content you published, pages you restructured, or prompts you added. A flat line with one spike usually means a single piece of content or engine update is driving most of the gain, which is worth investigating before assuming the improvement is broad and durable.
More tutorials in this section
 How to Read Your Visibility Score
Learn what the AmICited Visibility Score measures and how its gauge and platform breakdown show your AI …
Read guide →
How to Read Your Visibility Score
Learn what the AmICited Visibility Score measures and how its gauge and platform breakdown show your AI …
Read guide →
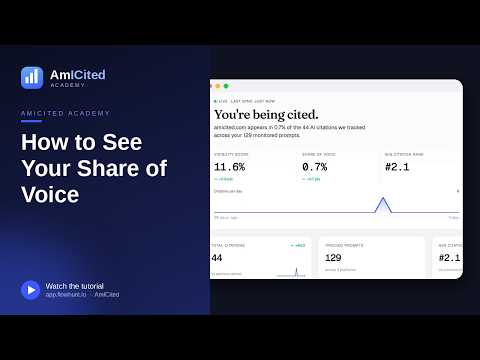 How to See Your Share of Voice
Find your AmICited Share of Voice and learn how it compares with your Visibility Score.
Read guide →
How to See Your Share of Voice
Find your AmICited Share of Voice and learn how it compares with your Visibility Score.
Read guide →
 How to Use the Domain Semantic Map
Explore the AmICited Domain Semantic Map to find clusters and topic gaps across prompts, fan-out queries and …
Read guide →
How to Use the Domain Semantic Map
Explore the AmICited Domain Semantic Map to find clusters and topic gaps across prompts, fan-out queries and …
Read guide →Ready to put it into practice?
Free check · 7-day trial · card required