


How to Track Citations Over Time by Source
Track daily AI citations by provider, top domains or URLs with the AmICited Sources chart.

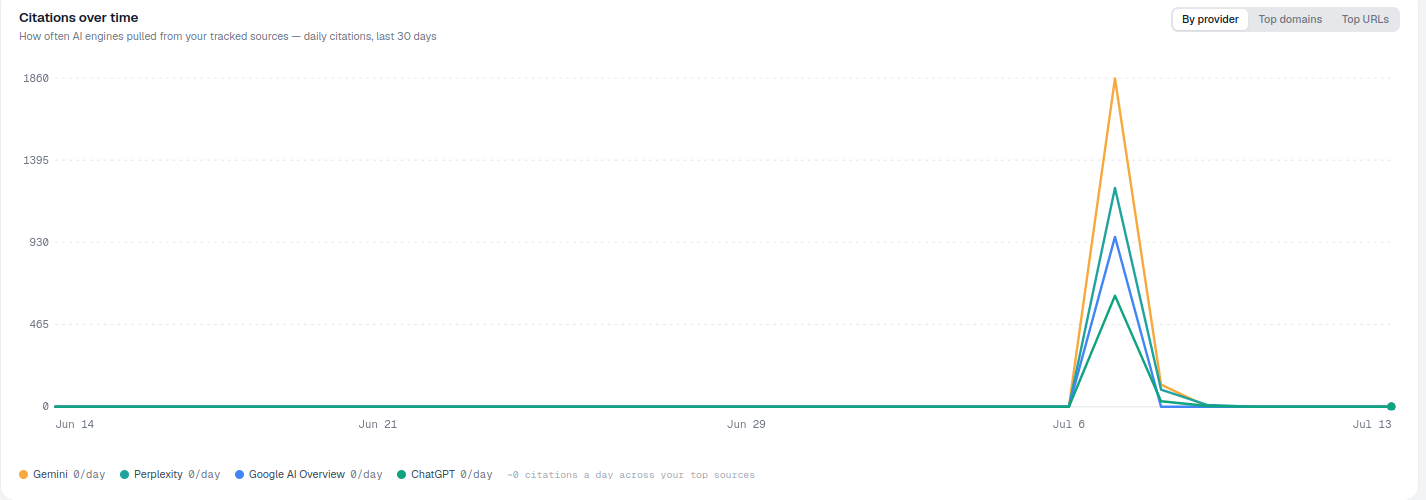
The Citations over time chart shows the rhythm of how AI engines draw on sources for your topics: daily citation volume across your tracked sources, so you can spot bursts of activity and steady trends.
Quick Steps
- Find the Citations over time chart near the top of the Sources page.
- Switch between By provider, Top domains, and Top URLs to re-slice the same data three ways.
- Read the trend over days or weeks rather than reacting to a single day’s count.
- Use Top domains or Top URLs to spot a competitor source suddenly gaining citation volume.
- Widen or narrow the date range to separate a short-term reaction from structural growth.
What is a citation, and why track it over time?
A citation is any moment an AI engine (ChatGPT, Perplexity, Gemini, or Google AI Overviews) pulls information from a specific web page and surfaces it in an answer, whether as a linked source, a named reference, or an unlinked mention of the underlying content. Citations are the atomic unit of AI search visibility: every brand mention, every “according to…” line, every source card in an AI Overview traces back to one. Unlike traditional rankings, which describe a static position on a results page, a citation is an event: it happens (or doesn’t) each time the AI engine generates an answer to a relevant prompt, and the same source can be cited on one day and dropped the next as the model’s underlying index, retrieval pipeline, or crawled snapshot of the page changes.
That volatility is exactly why looking at a single day’s citation count tells you very little. AI engines don’t cite sources on a fixed schedule the way a search engine ranks a page: they cite probabilistically, based on which sources their retrieval layer judged most relevant, authoritative, or recently crawled for a given prompt. A source can be cited five times on Monday and zero times on Tuesday for reasons that have nothing to do with the underlying content getting better or worse. Watching citation activity accumulate over days and weeks, rather than reacting to any single reading, is what turns raw citation counts into a signal you can actually act on. This practice is often called citation trend analysis : plotting citation frequency across a date range to separate real, sustained shifts in visibility from ordinary day-to-day noise.
Tracking citations over time also surfaces a second, related metric worth understanding: citation velocity , the rate at which citation volume for a source, topic, or competitor is accelerating or decelerating. A source with rising velocity is gaining ground with AI engines even if its absolute citation count is still modest; a source with falling velocity may be losing relevance even while sitting on a large historical citation total. Neither of those directional signals is visible from a single snapshot; you need the time series.
Finally, understanding where citations come from matters as much as how many there are. AI engines don’t draw from every page on the web equally: each one maintains what’s effectively a source pool it favors for a given topic, shaped by factors like site authority, content freshness, and how well a page is structured for retrieval. Watching which domains and URLs are earning citations over time, and which provider (ChatGPT, Perplexity, Gemini, AI Overviews) is doing the citing, tells you not just that your visibility is changing, but why, and which sources are worth studying or replicating.
Where to find it
It’s the Citations over time chart near the top of the Sources page, subtitled “How often AI engines pulled from your tracked sources: daily citations, last 30 days.” The Sources page is where AmICited’s AI visibility monitoring surfaces not just whether your brand gets cited, but which specific pages and domains are earning those citations across the AI engines you track.
What it measures
The chart aggregates every citation event recorded across your tracked prompts and topics into a daily count, then lets you re-slice that same underlying data three ways:
- By provider: one line per AI engine (ChatGPT, Perplexity, Gemini, Google AI Overviews), so you can see whether citation activity for your space is concentrated in a single engine or spread evenly across all of them.
- Top domains: one line per citing domain, showing which sites (yours, competitors’, or third-party publishers) are accumulating the most citation volume over the date range.
- Top URLs: one line per individual page, the most granular view, useful once you’ve identified a domain worth investigating further and want to know exactly which pages on it are doing the work.
This is distinct from a raw citation count on a single day; it’s a running record that lets you answer questions like “is our citation volume trending up or down this month” or “did a competitor’s page suddenly start getting cited more than ours”: questions that require comparing multiple points in time, not just the current total.
How to read it
- The line(s) show daily citation counts over the selected date range.
- The view tabs (top-right) reshape it: By provider colors a line per AI engine; Top domains breaks it out by site; Top URLs by individual page.
- The legend below shows each series and its current daily rate.
- Spikes mark days when a lot of citing happened at once, often when engines re-crawled or new content landed. A spike that fades back to baseline within a day or two is usually a one-off; a spike that resets the baseline higher is a genuine shift worth investigating.
How to use it
- Read the trend, not one day. Direction over weeks matters more than a single day’s dot. This is the practical application of citation trend analysis: let a few days or weeks of data accumulate before drawing conclusions from a dip or spike.
- Use By provider to see whether one engine is driving most of the citation activity for your space. If ChatGPT accounts for the bulk of your citation volume while Perplexity and Gemini barely register, that’s a signal about where to prioritize content and structural fixes, and a useful complement to the AI Overviews and per-engine breakdowns available in AmICited’s AI rank tracker .
- Use Top domains / Top URLs to spot a source that’s suddenly getting cited a lot: a competitor page worth studying. When a competitor’s URL climbs the Top URLs view faster than your own, that’s a concrete lead for a content gap analysis : what does that page cover, structure, or update that yours doesn’t?
- Change the date range at the top of the page to zoom the trend in or out. A 7-day window shows reaction to a recent content change or crawl event, while 30 or 90 days shows whether your overall citation volume is structurally growing.
- Cross-reference with your own domain. If your own site appears in the Top domains view, track whether its share of total daily citations is growing relative to competitors. A rising share here is a leading indicator of gains in share of voice , the broader metric of how much of the total AI conversation around your topics your brand is capturing.
Understanding how ChatGPT and other engines select and weight sources (see where ChatGPT gets its information for a deeper look at that mechanism) makes the patterns in this chart much easier to interpret, since a provider or domain shift here is often the downstream effect of a change in how that engine’s retrieval pipeline is sourcing answers.
Once you’ve established a baseline in this chart, it becomes the anchor for a lot of the day-to-day work of managing AI search visibility: catching a competitor’s content push while it’s still building momentum, confirming that a technical or content fix actually moved citation volume rather than just your own instinct, and building the kind of week-over-week reporting that agencies and in-house teams alike need to demonstrate progress. If you’re evaluating your current approach to this kind of monitoring, it’s worth comparing how different AI citation tracking tools handle time-series and source-level data, and if you’re managing this across multiple client accounts, AmICited’s tools for agencies extend this same Sources view across an entire portfolio, so you’re never reading trends for just one brand in isolation.
Frequently asked questions
By provider draws one line per AI engine, showing whether citation activity is concentrated in one model or spread across all of them. Top domains shows one line per citing site, and Top URLs breaks it down to individual pages, the most granular view for identifying exactly which page on a domain is earning the citations.
A spike marks a day when a lot of citing happened at once, often after AI engines re-crawled a site or new content went live. If the spike fades back to baseline within a day or two it's usually a one-off; if it resets the baseline higher, that's a genuine shift in citation activity worth investigating further.
A 7-day window shows the reaction to a recent content change or crawl event, while 30 or 90 days shows whether your citation volume is structurally growing rather than just reacting to a short-term event. Read the trend over weeks before drawing conclusions from any single day's dip or spike.
Switch to Top domains or Top URLs and watch for a competitor's line climbing faster than your own. When a rival's URL rises quickly in the Top URLs view, that's a concrete lead for a content gap analysis: study what that specific page covers or updates that yours currently doesn't.
More tutorials in this section
 How to Read Your Sources Overview Stats
Understand AmICited Sources stats: citations, domains, cited URLs, your pages, external sources and weekly …
Read guide →
How to Read Your Sources Overview Stats
Understand AmICited Sources stats: citations, domains, cited URLs, your pages, external sources and weekly …
Read guide →
 See Which AI Engines Cite Each Source
See how often each AI engine cites your top sources in AmICited’s Cited by Provider heatmap.
Read guide →
See Which AI Engines Cite Each Source
See how often each AI engine cites your top sources in AmICited’s Cited by Provider heatmap.
Read guide →
 How to Drill Down into a Single Source
Open any source in AmICited to see the exact pages and prompts where it was cited.
Read guide →
How to Drill Down into a Single Source
Open any source in AmICited to see the exact pages and prompts where it was cited.
Read guide →Ready to put it into practice?
Free check · 7-day trial · card required